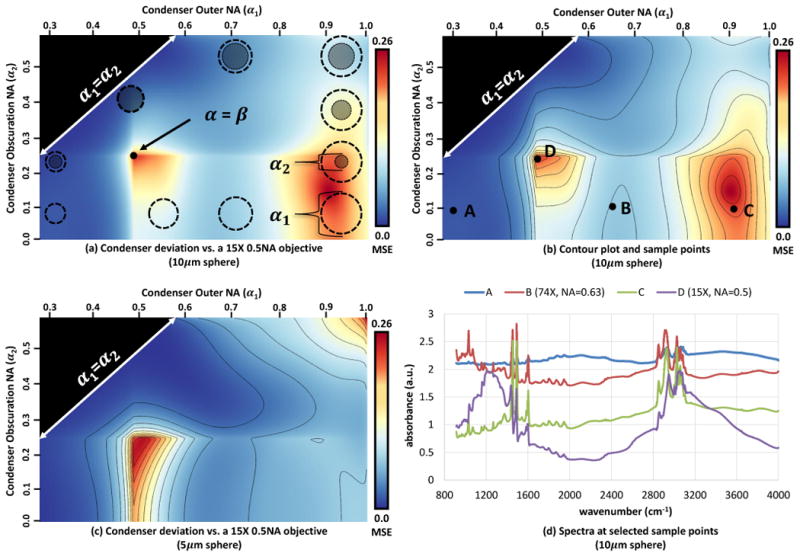
Fig. 4.

Deviation maps are computed for a 10μm and 5μm polystyrene spheres using parameters for a commercial 15X objective. The condenser geometry is summarized in (a) using circles do show the relative NA (α1) and center obscuration (α2). A contour plot and series of sample points are shown in (b), with the corresponding simulated spectra in (d). Note that a reduction in obscuration size and an increase in condenser NA dramatically improves spectral quality over matched optics (D), while condensers B and C show a reduction in both distortion and chemical signal. The spectrum for a low NA shows very little baseline deviation, while the chemical signal is significantly reduced (A). The deviation map for a 5μm sphere is shown in (c), demonstrating that the sample can affect the optimal optical system. MSE Values: A = 0.02, B = 0.12, C = 0.24, D = 0.26.
