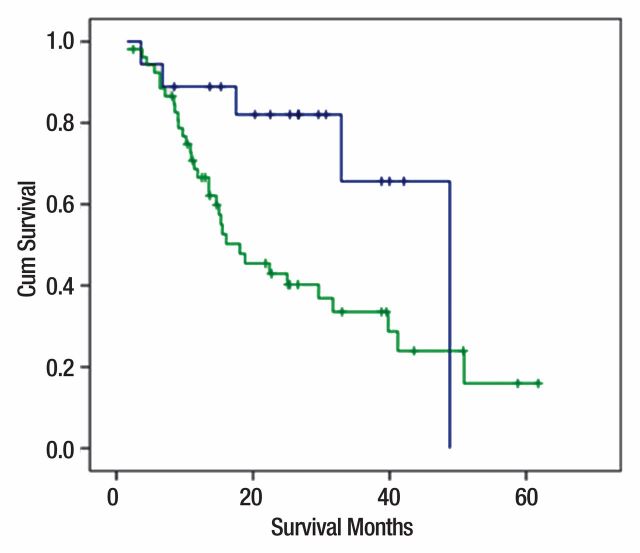
Figure 2c:
(a) Kaplan-Meier curves for changes in volumetric ADC in responders (n = 49; blue curve; ≥15% increase in ADC) and nonresponders (n = 22; green curve; decrease or <15% increase in ADC), with overall survival as primary end point. Median overall survival was 40 and 15 months for responders and nonresponders, respectively (log-rank test, P < .002). (b) Kaplan-Meier curves for changes in volumetric arterial enhancement in responders (n = 40; blue curve; ≥25% decrease in arterial enhancement) and nonresponders (n = 31; green curve; increase or <25% decrease in arterial enhancement), with overall survival as primary end point. Median overall survival was 40 and 16 months for responders and nonresponders, respectively (log-rank test, P < .02). (c) Kaplan-Meier curves for changes in volumetric venous enhancement in responders (n = 18; blue curve; ≥50% decrease in venous enhancement) and nonresponders (n = 53; green curve; increase or <50% decrease in venous enhancement), with overall survival as primary end point. Median overall survival was 49 and 18 months for responders and nonresponders, respectively (log-rank test, P < .02). Cum = cumulative.

