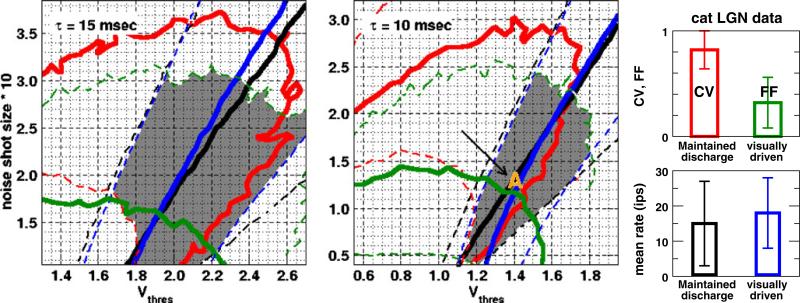
Fig. 4.
Choice of model parameters is constrained within one standard deviation from the population averages of experimental data. (Right) Population averages of mean rates and variability in the maintained (Mukherjee and Kaplan 1998) and visually-driven (Kara et al. 2000) discharges of cat LGN neurons. Error bars are standard deviations. (Left, Middle) Isolines of Figs. 2 and 3, whose values correspond to population averages (solid) and one standard deviation from the population averages (dashed) of experimental data, are drawn here as a contour map. Black and red are the mean rate and CV in the maintained discharge; blue and green are the mean rate and Fano factor in the visually-driven discharge. The gray shaded area is the possible parameter space under these constraints, and the parameter set used in subsequent cortical studies is marked by A (in orange)

