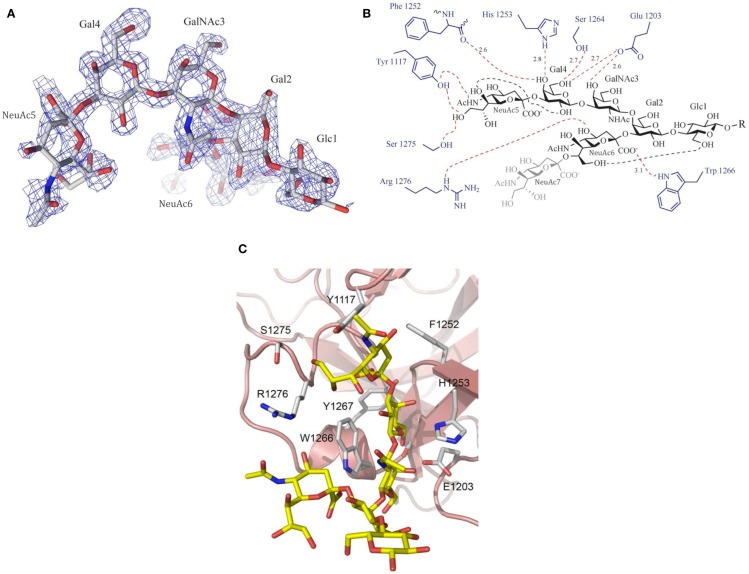
Figure 3.
Example of ganglioside recognition [here: GT1b (analog) and its interaction with botulinum neurotoxin type A (BoNT/A)]. (A) Experimental electron density (Fo–Fc omit map) of the ganglioside head group. (B) Schematic drawing of the interactions between GT1b and BoNT/A. Hydrogen bonds are shown as dotted lines (red: intermolecular interactions; black: intramolecular carbohydrate–carbohydrate interactions). (C) Close-up view of the ligand-binding site. Please note the aromatic stacking interactions with Trp 1266 and Tyr 1117. Printed with permission from Ref. (40).

