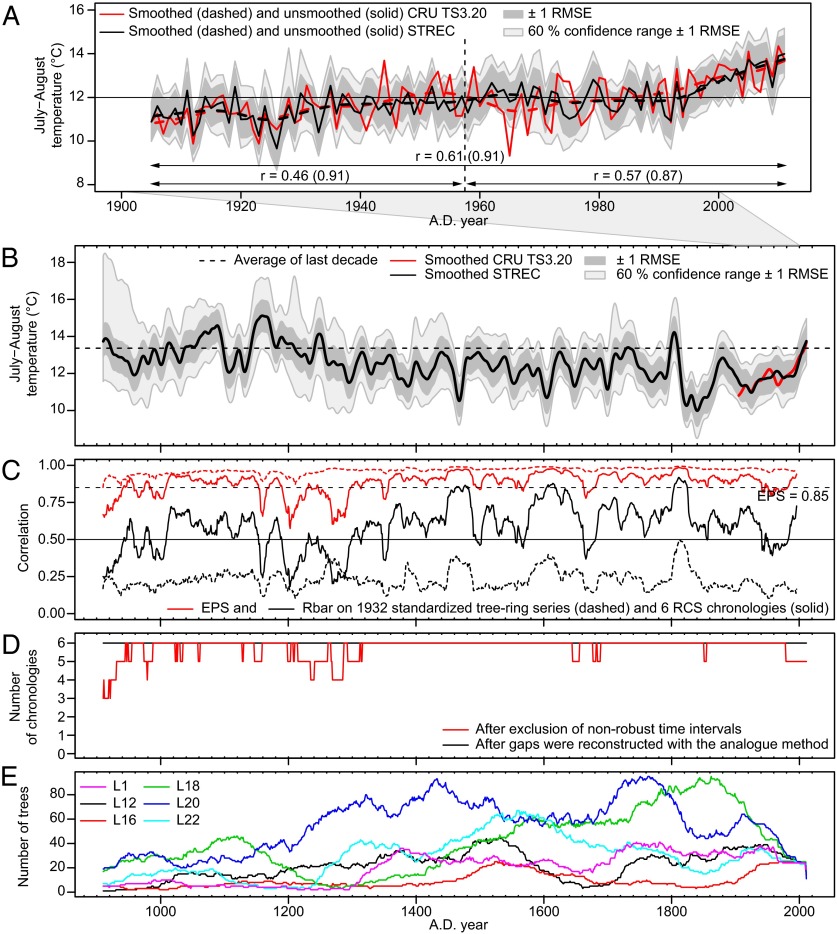
Fig. 1.
STREC reconstructed values and robustness. Observed (15 cells of the CRU TS3.20 dataset covering our sampling sites) and reconstructed (STREC) July−August temperatures in the taiga of Eastern Canada during the last century (A) and the last 1,100 y (B). Smoothed values are 20-y splines. In A, correlations between brackets refer to smoothed values. Expressed Population Signal (EPS) and Rbar statistics computed over 31-y moving windows are also shown (C), as well as replication among (D) and within (E) chronologies.

