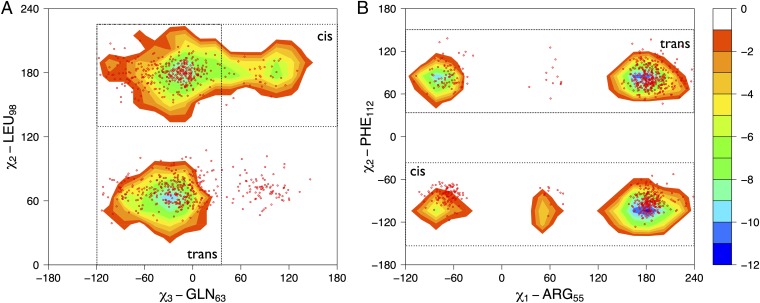
Fig. 2.
Cyclophilin A samples regions of its conformational space in the absence of the substrate similar to those sampled during the catalytic turnover. Free-energy surfaces for the bound state of cyclophilin A as a function of active site and protein core side chains are shown. (A) Free-energy landscape as a function of the χ3 dihedral angle of GLN63 and the χ2 dihedral angle of LEU98. (B) Free-energy landscape as a function of the χ1 dihedral angle of ARG55 and the χ2 dihedral angle of PHE112. The isolines are plotted at intervals of 2.0 kJ/mol. The contours represent the trans-bound– and cis-bound–specific basins; the red dots represent the free ensemble.

