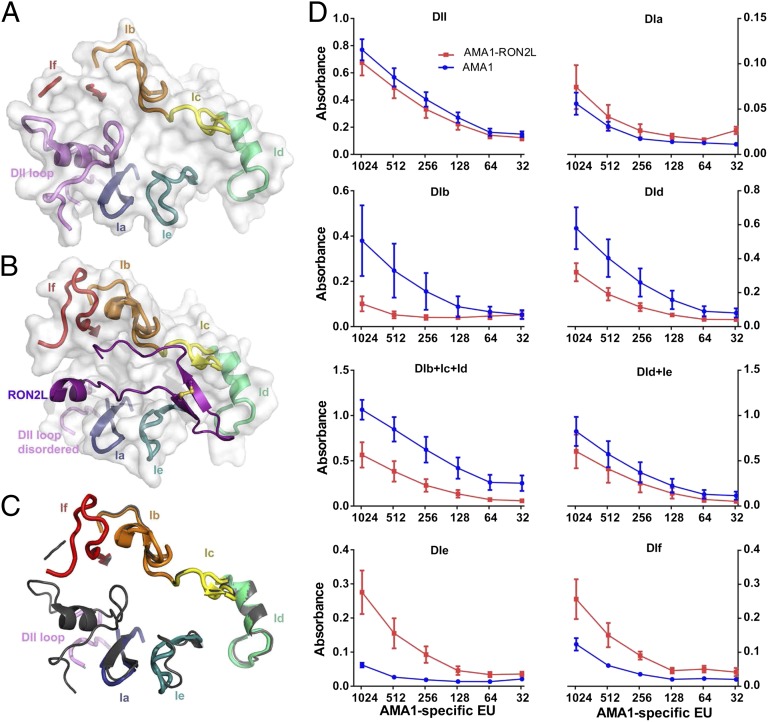
Fig. 3.
Proportion of anti-AMA1 and anti–AMA1-RON2L complex IgG to loop regions surrounding the AMA1 hydrophobic groove. (A) View of the loops surrounding the hydrophobic groove in the absence of RON2L. (B) View of the loops in the RON2L-bound form. (C) Overlay of AMA1 loop structures surrounding the hydrophobic groove in the presence (colored) and absence of RON2L (gray). (D) Binding of IgG from AMA1 (blue) and AMA1-RON2L complex (red) to biotinylated peptides immobilized on streptavidin plates. The x-axis indicates the amount of total AMA1-specific EU present at each of the dilutions. Data are mean ± SEM (n = 4). An experiment representative of three independent experiments is shown.

