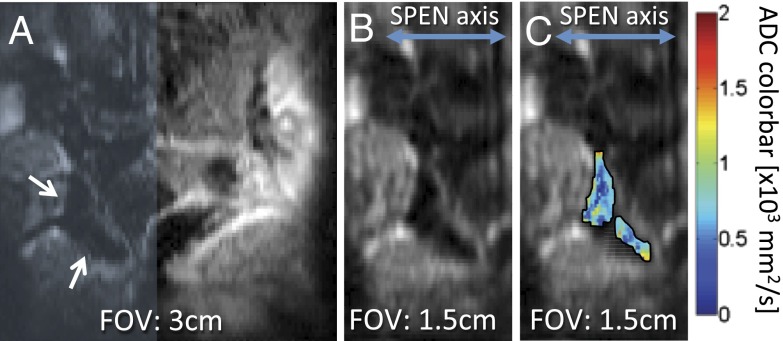
Fig. 3.
Representative example of SPEN’s zooming abilities, illustrated on a 2-mm slice containing mouse placentas on E18.5. (A) SPEN magnitude image on the full (30 × 30 mm2) FOV. (B) Restricted FOV (15 × 30 mm2, resolution = 0.15 × 0.3 mm2), corresponding to the shaded area in A. (C) ADC maps of two placentas indicated by the arrows in A, overlaid on top of the zoomed SPEN image.

