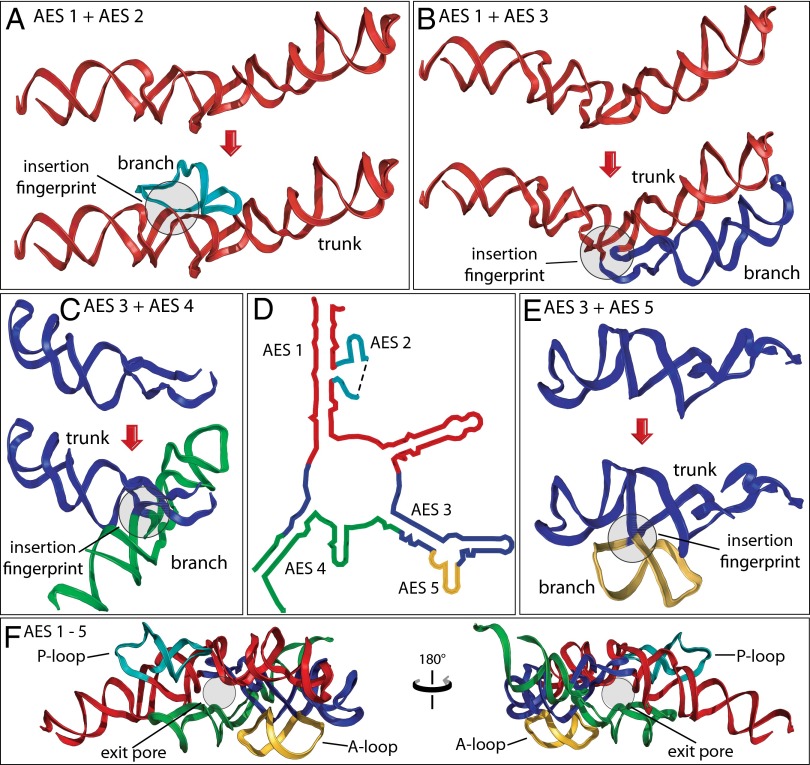
Fig. 5.
Origins and evolution of the PTC. Trunk rRNA is shown before and after insertion of branch helix. (A) AES 1 (red) is expanded by insertion of AES 2 (teal). (B) AES 1 is expanded by insertion of AES 3 (blue). (C) AES 3 is expanded by insertion of AES 4 (green). (D) The secondary structure of AESs 1–5, which form the PTC and the exit pore (helices 74, 80, 89, 90, and 91–93). The ends of AES 2 are located in direct proximity to each other in three dimensions, indicated by a dashed line in the secondary structure. (E) AES 3 is expanded by insertion of AES 5 (gold). (F) The 3D structure of AESs 1–5, colored as in A–E. In each case, the before state was computationally modeled by removing the branch helix and sealing the trunk using energy minimization protocols. Positions of the P loop, the A loop, and the exit pore are marked. Enlarged and more detailed representations of the structures of AESs 1–5 are available in SI Appendix, Figs. S6–S9.

