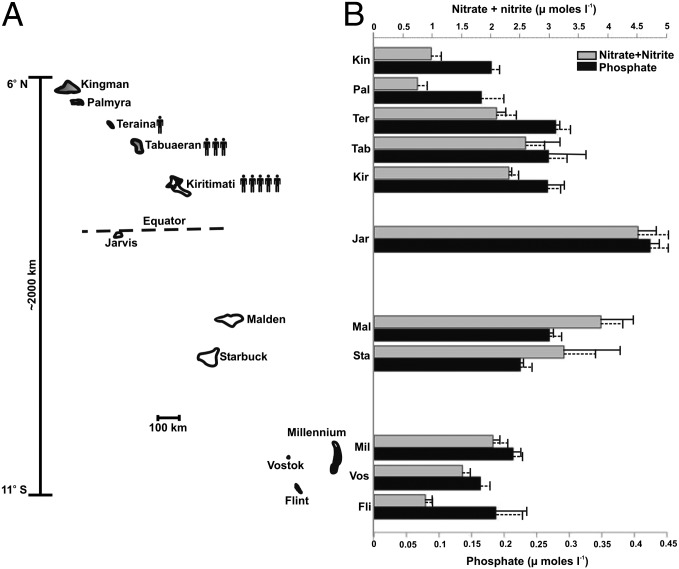
Fig. 1.
The LIs and their nutrient concentrations. (A) The 11 main atolls sampled in this study. The scale on the left indicates latitude and distance between atolls. Atoll sizes are proportionate, but not to scale. (B) Average nutrient concentrations at the 11 atolls. Nutrient concentrations were measured in triplicate for each of the 22 study sites (n = 66) and averaged; sites were then averaged for each atoll. Solid and dashed error bars show the SE for atoll and site replicates, respectively. Average values for each site are provided in Table S2.

