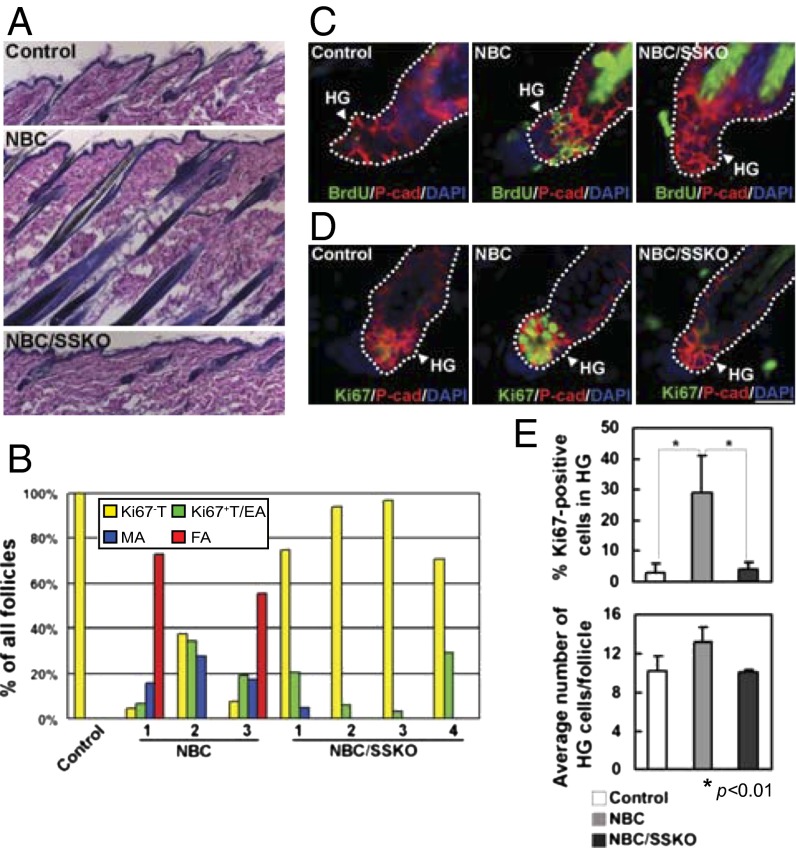
Fig. 2.
Hair cycle and HG proliferation in control, NBC, and NBC/SSKO mice. (A) H&E analysis of P63 skin (n = 2). (B) Quantification of hair cycle distribution in P56 skin. Number indicates individual mouse with the indicated genotypes. EA, early anagen; FA, full anagen; MA, mid anagen; T, telogen. See SI Materials and Methods for stage determination. (C and D) Indirect immunofluorescent detection of BrdU+ (C) and Ki67+ (D) cells in the HG (P-cadherin+). (E) Quantification of Ki67+ HG cells (Upper) and average number of HG cells per each HF section (Lower) in control (n = 4), NBC (n = 7), and NBC/SSKO (n = 4) mice. Error bars denote SD. Exact genotypes are Pygo2+/f or K14-Cre/Pygo2+/f for the control group and NBC/Pygo2+/f or NBC/K14-Cre/Pygo2+/f for the NBC group. [Scale bar, 180 μm (A) and 20 μm (C and D).]

