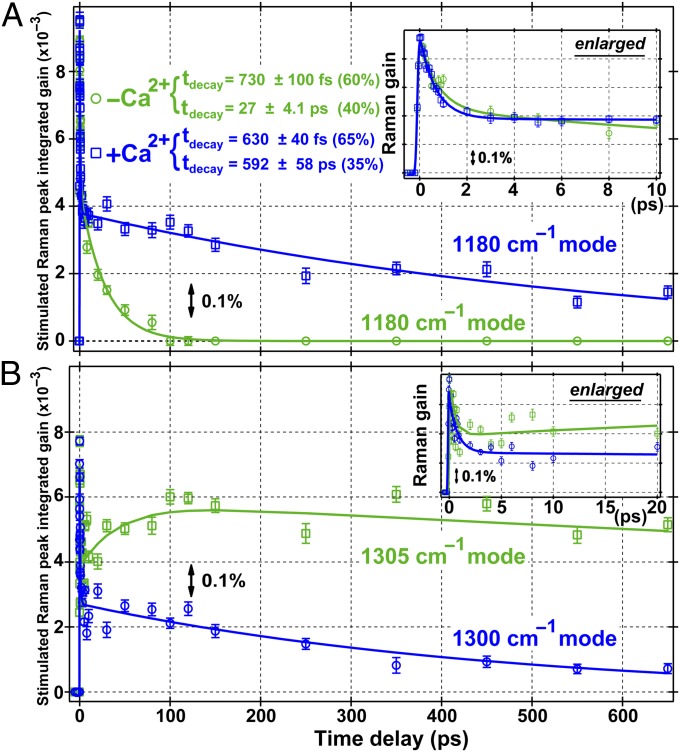
Fig. 3.
Time evolution of two excited-state vibrational modes for both Ca2+-free (green) and bound (blue) GEM-GECO1 up to 650 ps following 400-nm photoexcitation. (A) The 1,180 cm−1 A* mode shows biexponential relaxation but with much lengthened long-time decay with Ca2+. The enlarged dynamics plot up to 10 ps exhibits a similar initial decay. The −Ca2+ peak is normalized to the stronger +Ca2+ peak with a scaling factor of 2. (B) The 1,305/1,300 cm−1 mode in Ca2+-free/bound protein shows distinct dynamics. There are overlapping A* and I* modes in the Ca2+-free protein and the dominant ESPT timescale is ∼30 ps. The −Ca2+ peak is normalized to the stronger +Ca2+ peak with a scaling factor of 3. Error bars, SD of the Gaussian-fitted peak area (n = 3). Solid lines are fits to data points, and the peak integrated gain is plotted to better represent the mode intensity due to small variations of the broad ES peak width.

