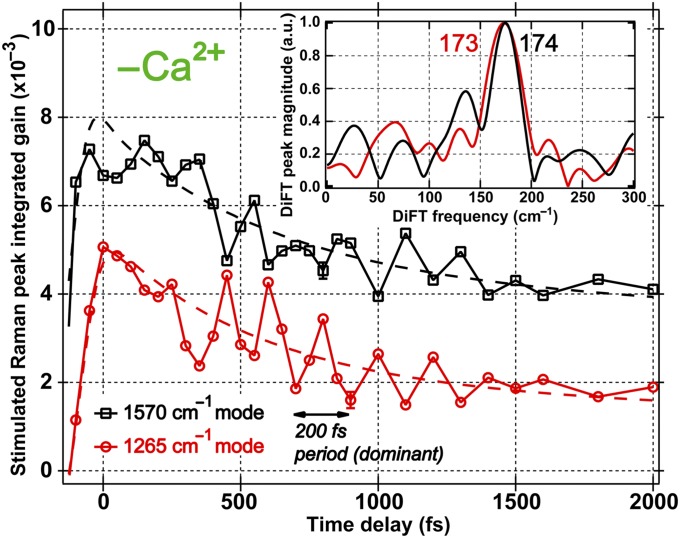
Fig. 4.
Temporal evolution and quantum beats of the 1,265 and 1,570 cm−1 excited-state vibrational modes of the Ca2+-free GEM-GECO1 following 400-nm photoexcitation. The two marker band intensities during the first 2 ps manifest an oscillatory pattern with a 200-fs period, whereas the 1,265 cm−1 phenolic C–O stretch (red) is anti-phase with the imidazolinone C = N stretch (black) at 1,570 cm−1. Inset shows normalized DiFT spectra of the coherent residuals after removing the incoherent exponential fits (dashed lines), which manifests a prominent ∼170 cm−1 mode.

