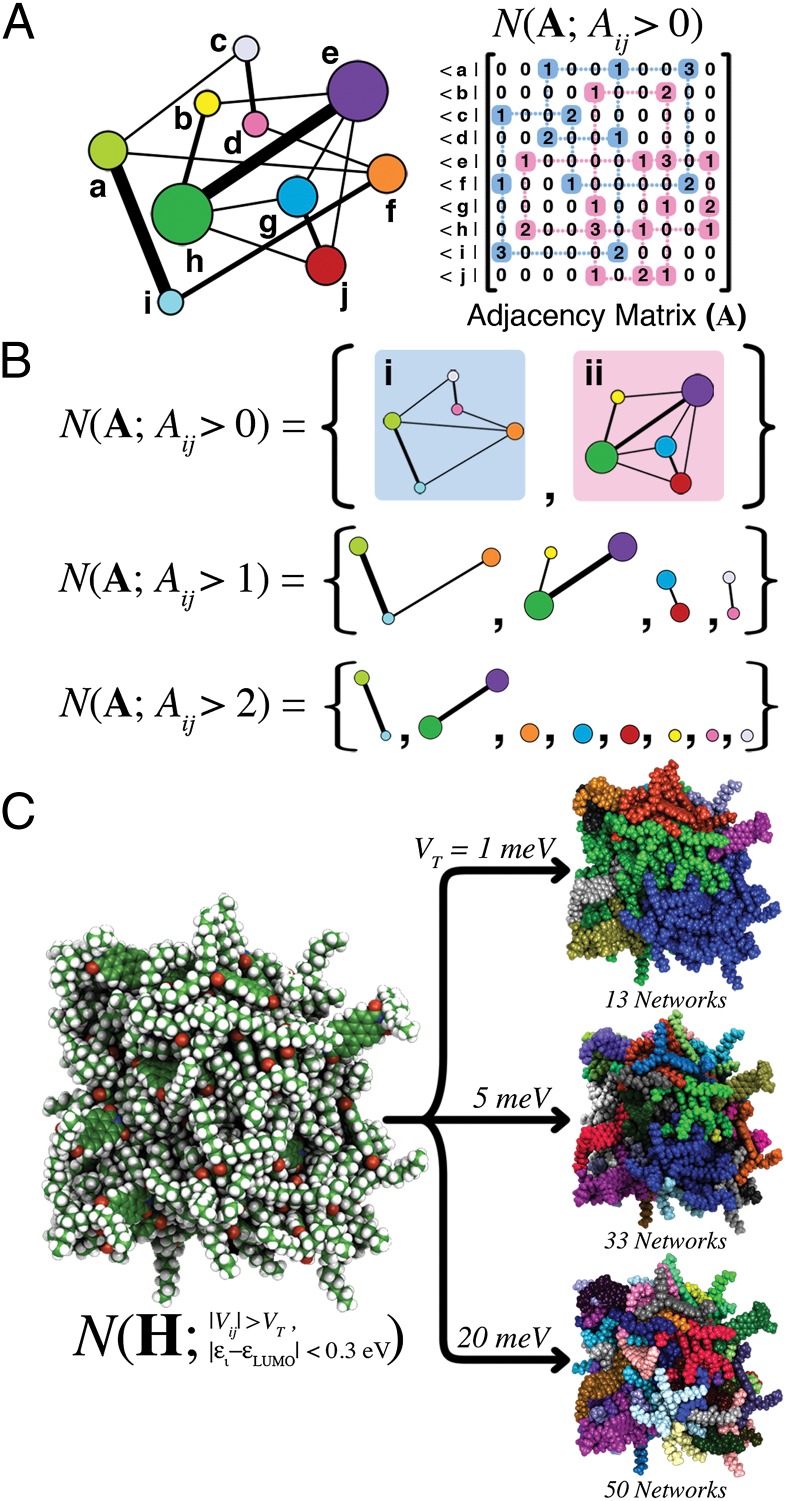
Fig. 2.
(A, Left) Generalized graph of vertices (a–h) and edges (lines). The edge thickness corresponds to the strength of the connection between vertices, and vertex radii are scaled according to the number of finite capacity edges per vertex. (A, Right) Pedagogic representation of the network analysis algorithm N acting on the adjacency matrix A for the graph on the Left. (B) Returned networks for finite capacity (Aij > 0), edge capacity greater than 1 (Aij > 1), and edge capacity greater than 2 (Aij > 2). (C, Left) Snapshot of 64 DO-PDI molecules from a MD trajectory. Network analysis is performed using states within 0.3 eV of the DO-PDI LUMO, and a variable electronic coupling threshold, VT. (C, Right) Returned networks for a range of thresholds: VT values of 1, 5, and 20 meV. In each case, distinct electrical networks are given a unique color, and the total number of networks is specified beneath each cluster.

