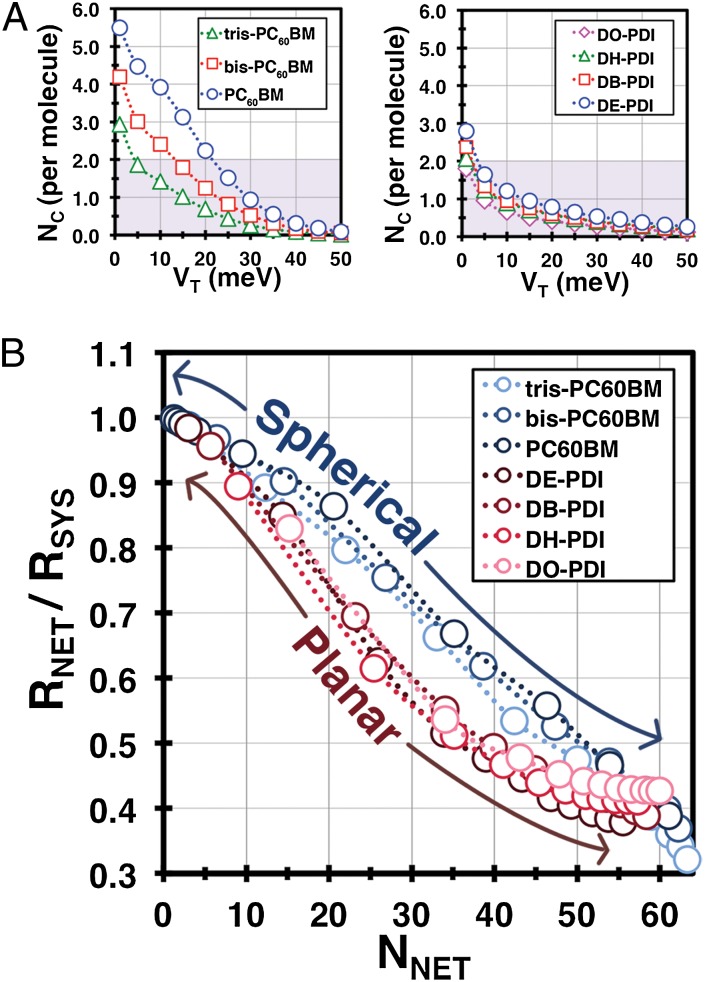
Fig. 4.
(A, Left) Average number of connections per molecule, NC, in C60 derivatives as a function of the electronic coupling threshold (VT). (Right) NC as a function of coupling threshold for the PDI derivatives. Shaded areas indicate nonpercolative conditions. (B) Number of networks (NNET) versus the percolation ratio (RNET/RSYS) compared across all materials. Lines added as a guide to the eye, “spherical” refers to the C60 derivatives (in blue) and “planar” to the PDI derivatives (in red).

