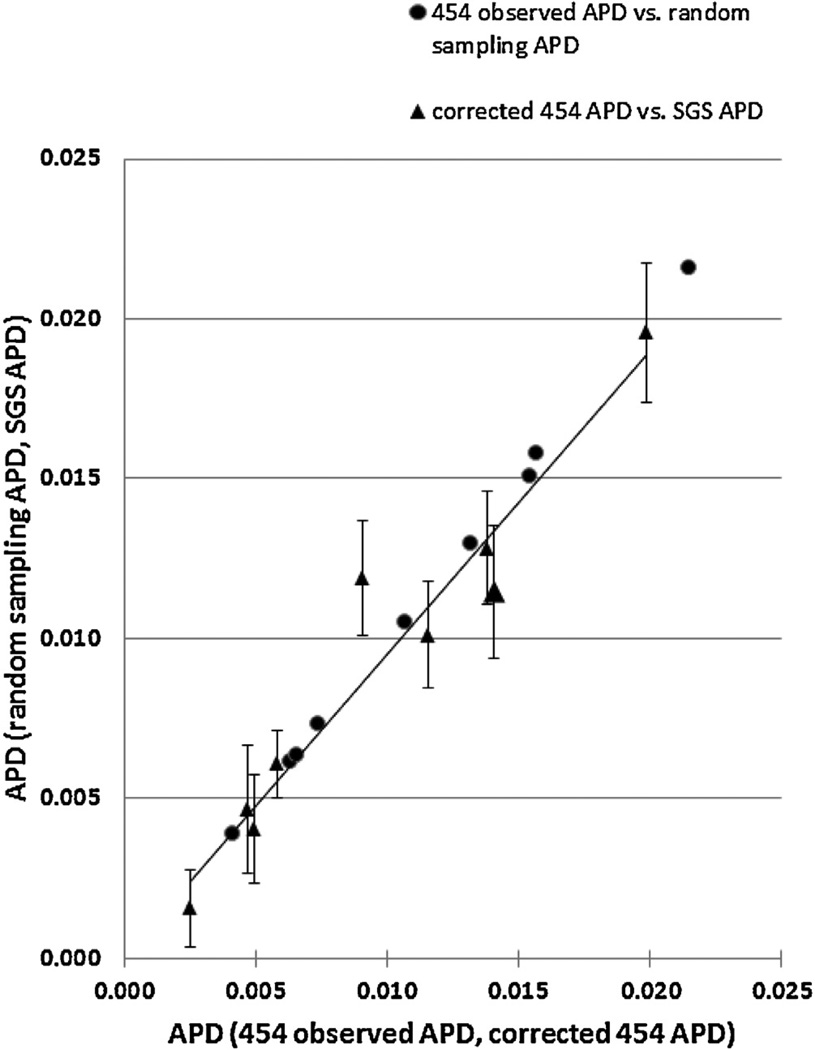
Fig. 4.
Correlation between SGS and corrected 454 diversities. Both X-axis and Y-axis are APD. The series represented by triangles is corrected 454 diversity vs. SGS diversity; the series represented by circles is 454 diversity corrected from double mutations vs. corrected diversity estimated from the average from 100 random sampling from 454. 454 observed APD and corrected 454 APD are on X-axis, and random sampling 454 APD and SGS APD are on Y-axis. The error bars are the standard deviations of random sampling 454 APD.

