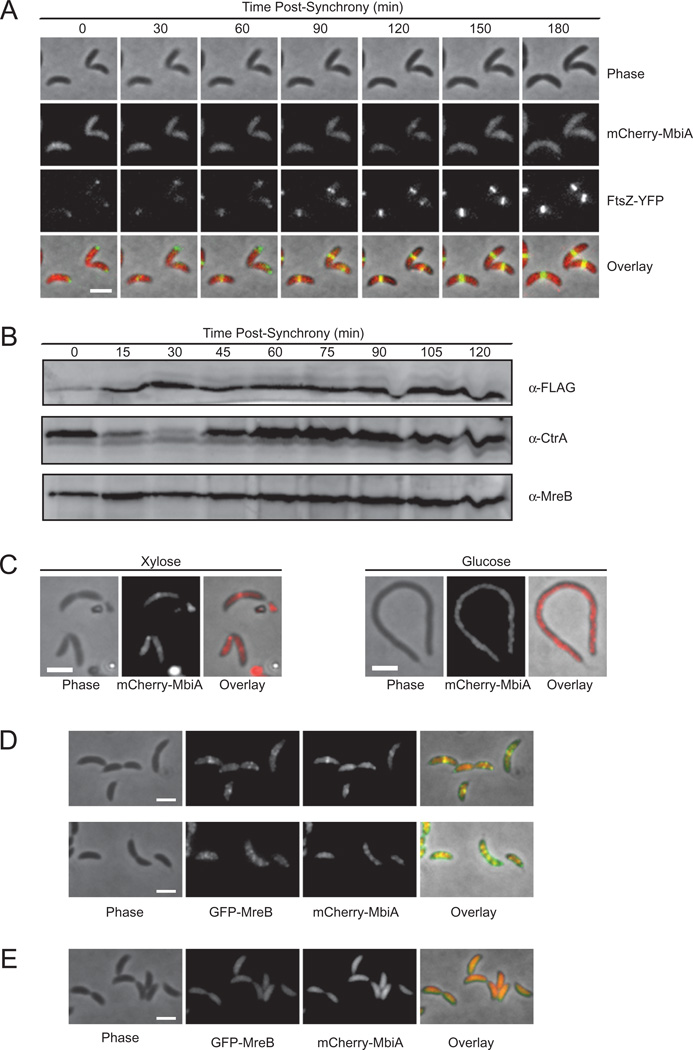
Fig. 1. Cell cycle dependence and localization of MbiA.
A. Time-lapse microscopy of ZG691 expressing mCherry-MbiA and FtsZ-YFP. FtsZ-YFP was induced with xylose for 1 h, and mCherry-MbiA was induced with vanillate for 2 h. Cells are shown at the indicated times after synchronization. PYE agarose pads supplemented with vanillate were used for microscopy. The images, from top to bottom, are phase contrast, mCherry-MbiA fluorescence, FtsZ-YFP fluorescence, and an overlay of the three images.
B. Immunoblot with anti-FLAG, anti-CtrA and anti-MreB antibodies of the synchronized ZG694 cells expressing MbiA-FLAG as a native-site fusion at the indicated time points after synchronization.
C. Phase-contrast (left), mCherry-MbiA fluorescence (middle), and phase/fluorescence overlay (right) of ZG693 after 4 h of FtsZ depletion (Glucose) or with continued FtsZ expression (Xylose) in M2G or M2X respectively.
D. Colocalization of GFP-MreB and mCherry-MbiA in a double-labelled strain ZG692 grown in PYE supplemented with xylose and vanillate. The images, from left to right, are phase contrast, GFP-MreB fluorescence, mCherry-MbiA fluorescence, and an overlay of the three channels.
E. Colocalization of GFP-MreB and mCherry-MbiA in ZG692 grown in PYE supplemented with xylose and vanillate before treatment with 50 µg ml−1 of A22 on the agarose pad only. The images, from left to right, are phase contrast, GFP-MreB fluorescence, mCherry-MbiA fluorescence, and an overlay of the three channels. All scale bars are 2 µm.

