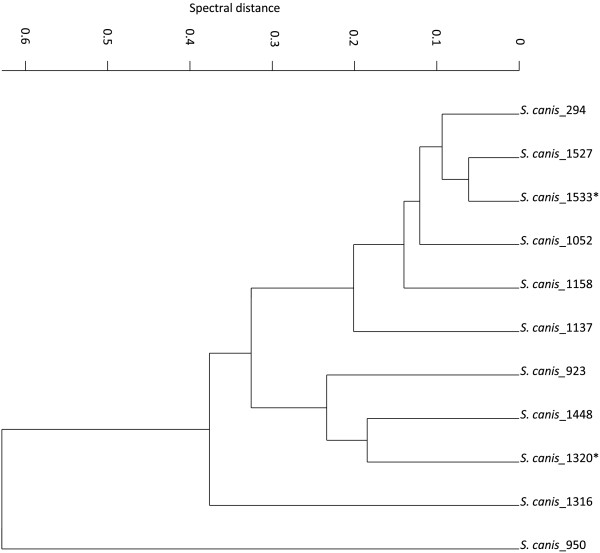
Figure 1.

Hierarchical cluster analysis of S. canis. Hierarchical cluster analysis (HCA) of the first derivatives of FTIR spectra from S. canis isolates. Based on the HCA strains were divided into the external validation and training set (for details see text). Spectral region used were 3.000 – 2.800 cm-1, 1.800 – 1.500 cm-1, 1.500 – 1.200 cm-1, 1.200 – 900 cm-1 and 900 – 700 cm-1. Distances were calculated with normalization to a reproduction level of 30 and the clustering algorithm was Average Linkage algorithm. * indicate strains used for the validation set.
