
Figure 3.
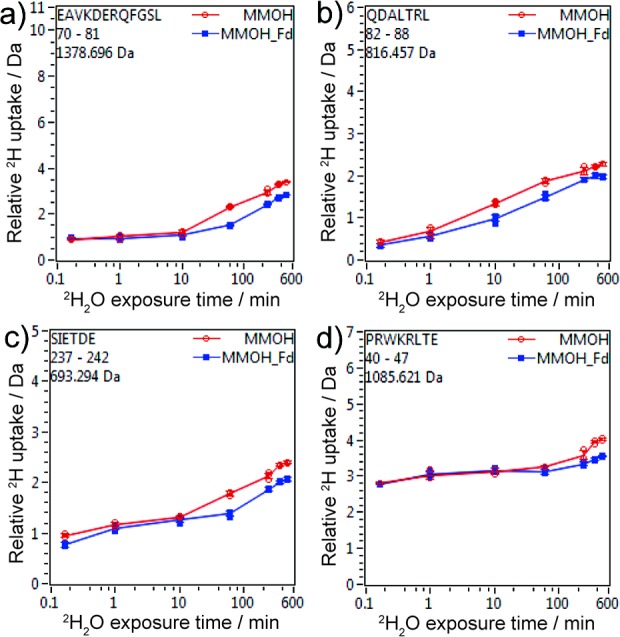
Hydrogen–deuterium exchange kinetics for four representative peptides that showed different deuterium uptake in the presence (blue traces) or absence (red traces) of Fd: (a) residues 70–81, α-subunit; (b) residues 82–88, α-subunit; (c) residues 237–242, α-subunit; and (d) residues 40–47, β-subunit. The largest number on the y-axis represents the maximum amount of deuterium that can be incorporated in each peptic peptide.