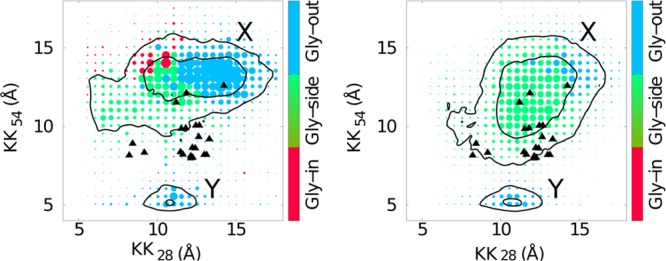
Figure 6.

Left: distance between AK28 and BK28 (KK28) and AK54 and BK54 (KK54) colored by the most populated ψ4G: red, green, and blue correspond to Gly-in, Gly-side, and Gly-out conformations for data of CG simulations in 70 DPC surfactant molecules. The right panel corresponds to KK28 and KK54 for the C9915–55 system in 108 DPC surfactant molecules. The spot size corresponds to the number of structures for that particular KK28 and KK54 conformation.
