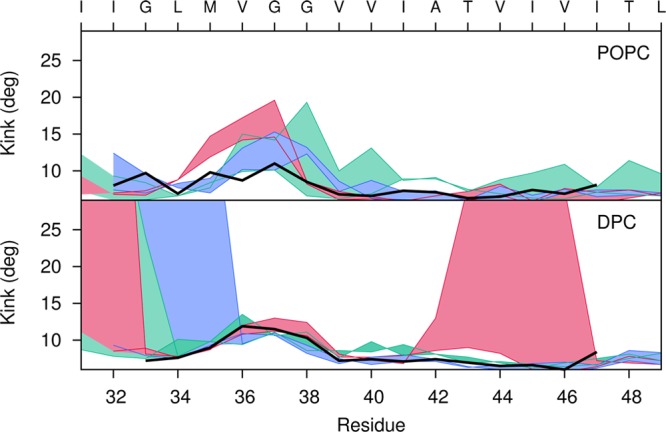
Figure 8.

Measurement of the observed kink angle for each peptide of the all-atom simulations of C9915–55 homodimer in a POPC bilayer (top) and DPC micelle (bottom). For the three different systems, Gly-in (dark pink), Gly-out (blue) and Gly-side (green), the filled curve represents the difference ΔA–Bkink = θA – θBkink, where θA and θBkink are the kink angles of peptides A and B, respectively. The hinge angle in the C9915–55 monomer12 is shown in black for POPC bilayer and DPC micelle simulations.
