
Figure 7.
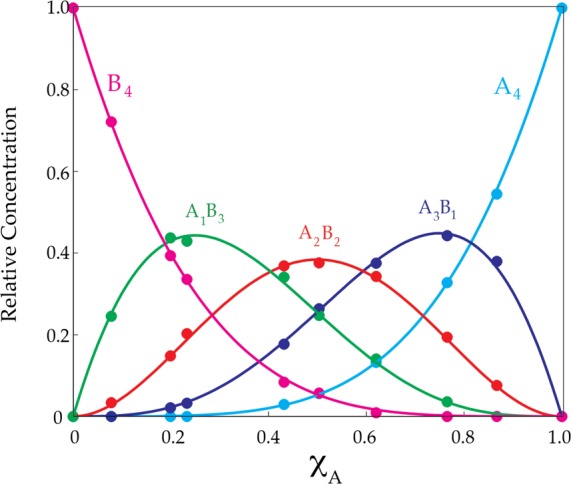
Job plot showing the relative concentrations of tetrameric homo- and heteroaggregates versus measured mole fractions of 11 (XA) for 0.10 M mixtures of sodium enolates 11 (A) and 13 (B) in 0.50 M TMEDA/toluene-d8 at −80 °C. The relative concentrations are obtained by simply summing the integrations of each aggregate represented in the two envelopes of resonances. (See Figure 6.).