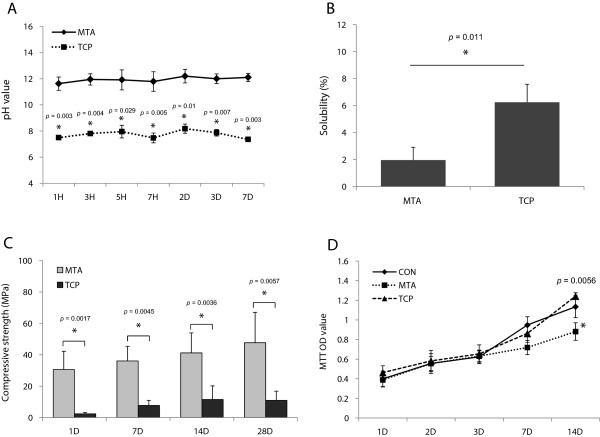
Figure 1.

The physical properties and cell viability of the tested materials. The pH values (A), solubility (B), and compressive strength (C) of MTA and TCP. Note that the setting time, pH values, and compressive strength of α-TCP was lower than that of MTA whereas the solubility of α-TCP was higher than that of MTA. (D) Effects of MTA and TCP on cell viability measured by MTT assay. The cell viability of α-TCP-treated samples was higher than those of MTA at day 14. *Significant difference between each group; P < 0.05.
