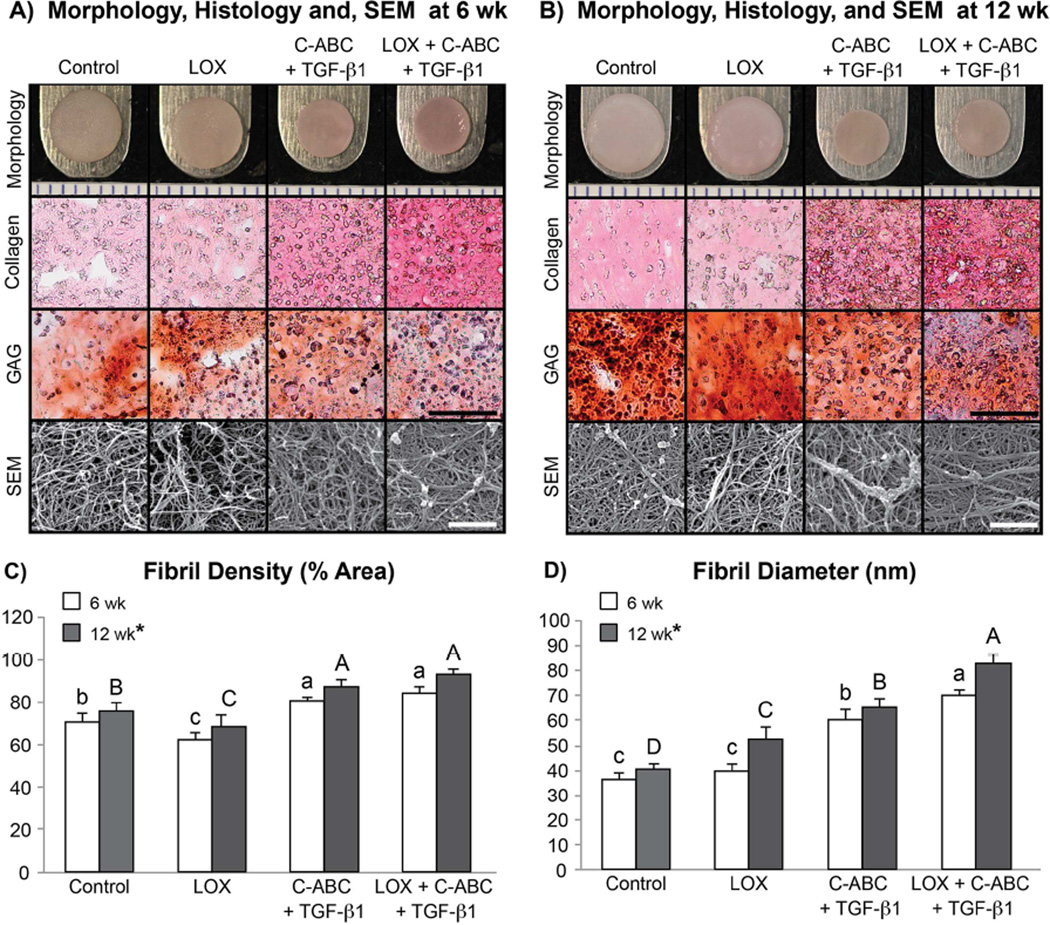
Fig. 1.
Phase 1 gross morphology (markings on ruler = 1 mm), Picrosirius Red for collagen and Safranin O/Fast Green for sulfated glycosaminoglycans (GAG) stained sections (scale bar = 100 µm), and representative scanning electron microscopy (SEM) images (scale bar = 1 µm) of untreated, LOX, C-ABC+TGF-β1, and LOX+C-ABC+TGF-β1 neofibrocartilage at t = 6 wk (A) and t = 12 wk (B). Collagen fibril density (C) and diameter (D) quantified from SEM images, bars not connected by the same letter are significantly different (p < 0.05), lower case letters denote significant differences for 6 wk constructs, upper case letters denote significant differences for 12 wk constructs, n = 6 per group, mean ± SD.

