
Figure 4.
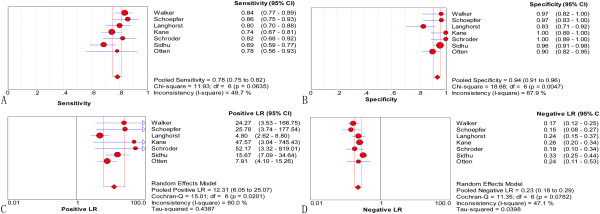
Forest plots of sensitivity (A), specificity (B), positive likelihood ratio (C), and negative likelihood ratio (D) with corresponding 95% CIs of FL in distinguishing IBD from IBS. The size of the solid circle indicates the effect size of each study.