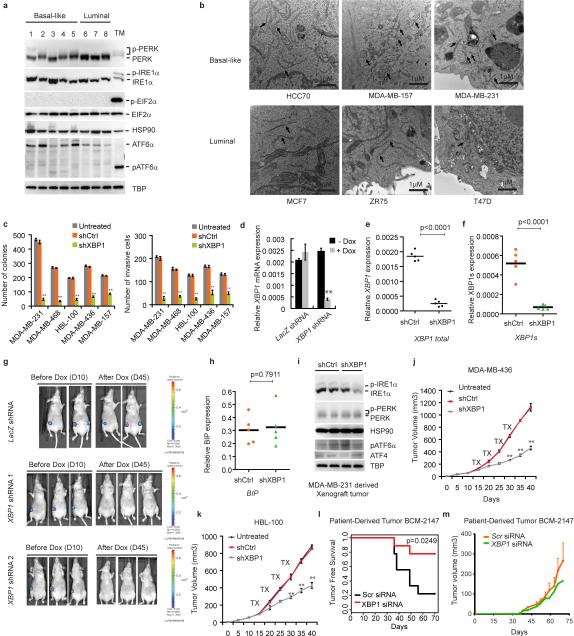
Extended Data Figure 1. Effect of XBP1 silencing on TNBC cells and UPR.
a, Activation of UPR in different breast cancer cells. Immunoblot of PERK phosphorylation, IRE1α activation (phos-tag SDS-PAGE), and EIF2α phosphorylation in whole cell lysates, and ATF6α processing (pATF6α) in nuclear extract of basal-like breast cancer cells (1: HCC1937; 2: MDA-MB-231; 3: SUM159; 4: MDA-MB-157; 5: HCC70) and luminal breast cancer cells (6: ZR-75-1; 7: T47D; 8: MCF7). TM: Positive control (whole cell lysates or nuclear extracts from MDA-MB-231 cells treated with 5μg/ml tunicamycin for 6 hours). HSP90 was used as loading control for whole cell lysates, TBP was used as loading control for nuclear extract. b, Transmission electron microscopic analysis of ER in basal-like and luminal breast cancer cell lines. Black arrows indicate the endoplasmic reticulum. All images are at 30,000× magnification. Scale bar represents 1μM. c, Quantification of soft agar colony formation and number of invasive cells in untreated and control shRNA or XBP1 shRNA infected breast cancer cells. Experiments were performed in triplicate and data are shown as mean ± SD. **p<0.01. d, Quantitative RT-PCR analysis of XBP1 expression in MDA-MB-231 cells infected with lentiviruses encoding doxycycline (DOX) inducible shRNAs against XBP1 or scrambled LacZ control, in the presence or absence of doxycycline for 48h. Data are presented relative to β-actin and shown as mean ± SD of technical triplicates. e-f, Knockdown efficiency of total XBP1 (e) and XBP1s (f) in MDA-MB-231 derived xenograft tumor (as in Fig.1d). Data are presented relative to β-actin. n=5. g, Bioluminescent images of orthotopic tumors formed by luciferase expressing MDA-MB-231 cells infected with different lentiviruses. A total of 1.5×10⁶ cells were injected into the fourth mammary glands of nude mice. Bioluminescent images were obtained 1 week later and serially after mice were begun on chow containing doxycycline (Dox) (day 10). Pictures shown are the day 10 images (Before Dox) and day 45 images (After Dox). h, Effect of XBP1 knockdown on ER stress marker BIP expression in MDA-MB-231 derived xenograft tumors. Quantitative RT-PCR analysis of BIP expression in shCtrl or shXBP1 xenograft tumor. Data are presented relative to β-actin. n=5. i, Immunoblot of IRE1α activation (phos-tag SDS-PAGE) and PERK phosphorylation in whole cell lysates; ATF6α processing and ATF4 expression in nuclear extracts of two shCtrl or shXBP1 xenograft tumors. HSP90 was used as loading control for whole cell lysates, TBP was used as loading control for nuclear extract. j-k, Tumor growth of untreated or control shRNA, or XBP1 shRNA treated MDA-MB-436 (j) or HBL-100 cells (k) in nude mice. Data are shown as mean ± SD of biological replicates (n=3). **p<0.01. Tx: Treatment with shRNA. l, Kaplan-Meier tumor free survival curve of mice from Fig. 1f. m, Tumor growth (mean ± SEM) of BCM-2147 tumors as in Fig. 1f (Scr siRNA: n=7; XBP1 siRNA: n=2).

