
Fig. 8.
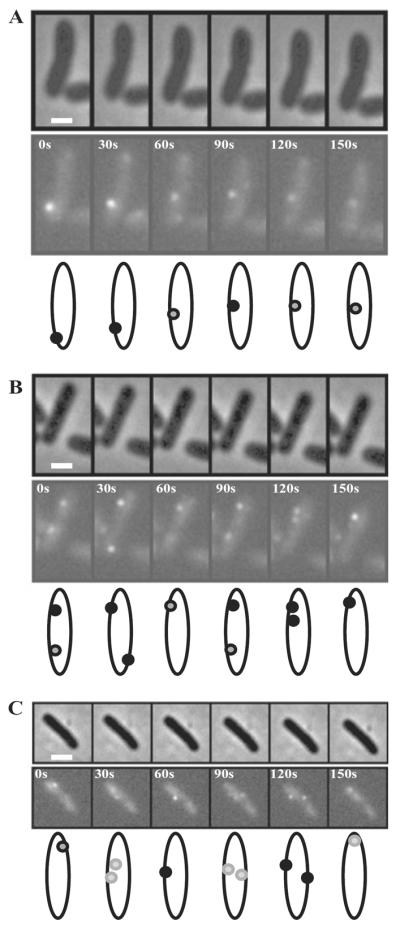
Time-lapse fluorescence and phase-contrast images of surface-grown wild-type cells expressing the WspR–YFP fusion protein. Images were acquired every 30 s. Individual cells were followed over a 150 s time period in (A), (B) and (C). Cartoons depicting the movement and change in fluorescence intensity of the spots in each cell are shown below each panel. The marker bar is 1 μm.