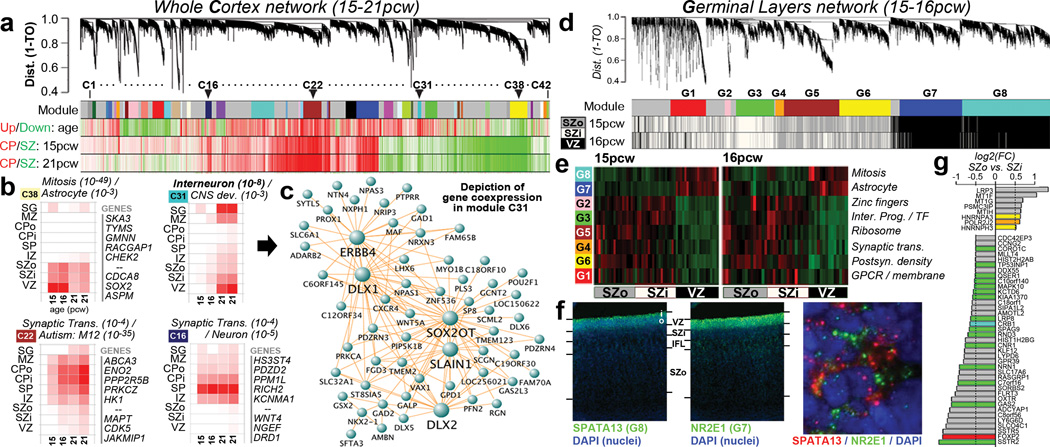
Figure 3. Co-expression analyses of prenatal cortex.
a. WGCNA cluster dendrogram on all 526 neocortical samples groups genes into 42 distinct modules (First row). Rows 2–4: Strong differential expression relationships are seen between module genes and age or cortical layer. b. Module eigengene (ME) expression of four notable modules in (a), averaged across brain and layer. Modules are biologically characterized with significant category enrichments and representative genes. Many top gene-gene connections for module C31 are shown in (c), including several known GABAergic interneuron genes. d. Cluster dendrogram for consensus network focused on germinal layers identifies modules (Row 1) enriched in each layer (Rows 2,3). e. ME heatmap shows differential VZ/SZ expression for 8 modules, along with enriched gene sets. f. FISH on 15pcw frontal cortex shows enrichment of SPATA13 and NR2E1 in mutually exclusive subcellular localization in VZ. g. Genes enriched in SZ, and differentially expressed between SZo and SZi. Genes color-coded by module (gray = unassigned).

