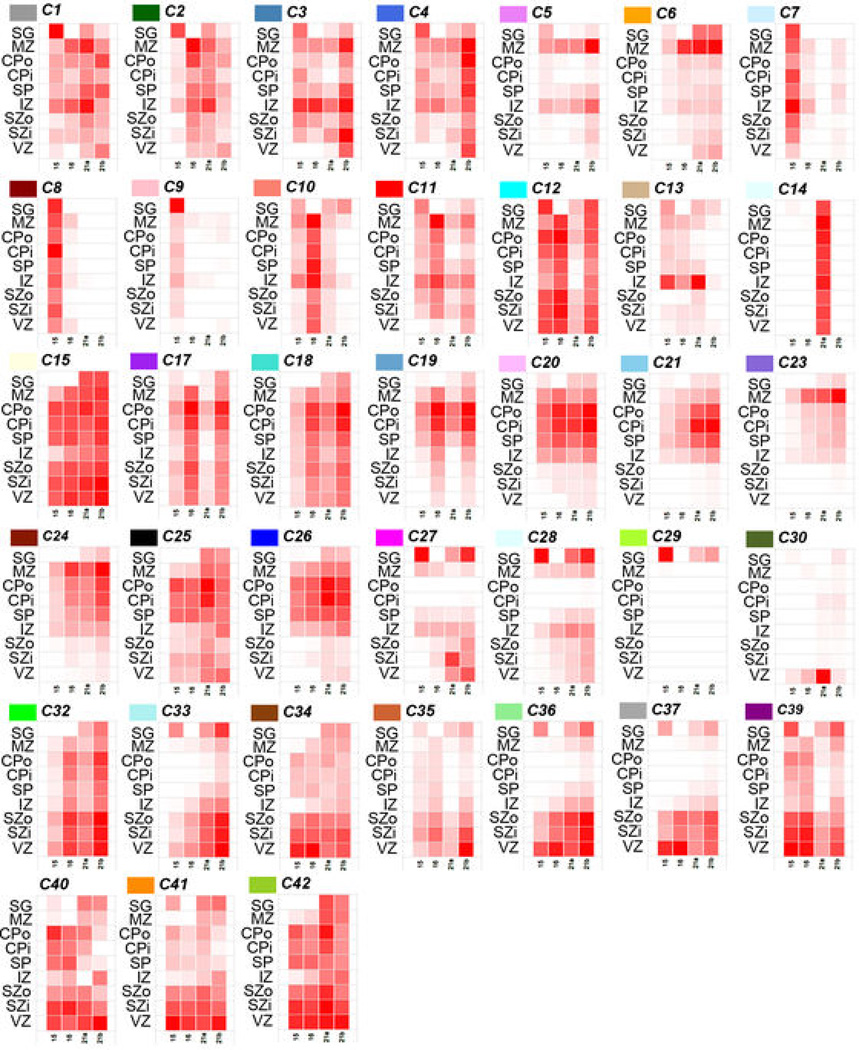
Extended Data Figure 4. Module eigengene expression of remaining modules in the cortical network.
Module eigengene expression of remaining 38 modules averaged across brain and layer. Each box corresponds to average module eigengene expression of all samples in that layer (rows) and brain (columns). Red = higher expression.

