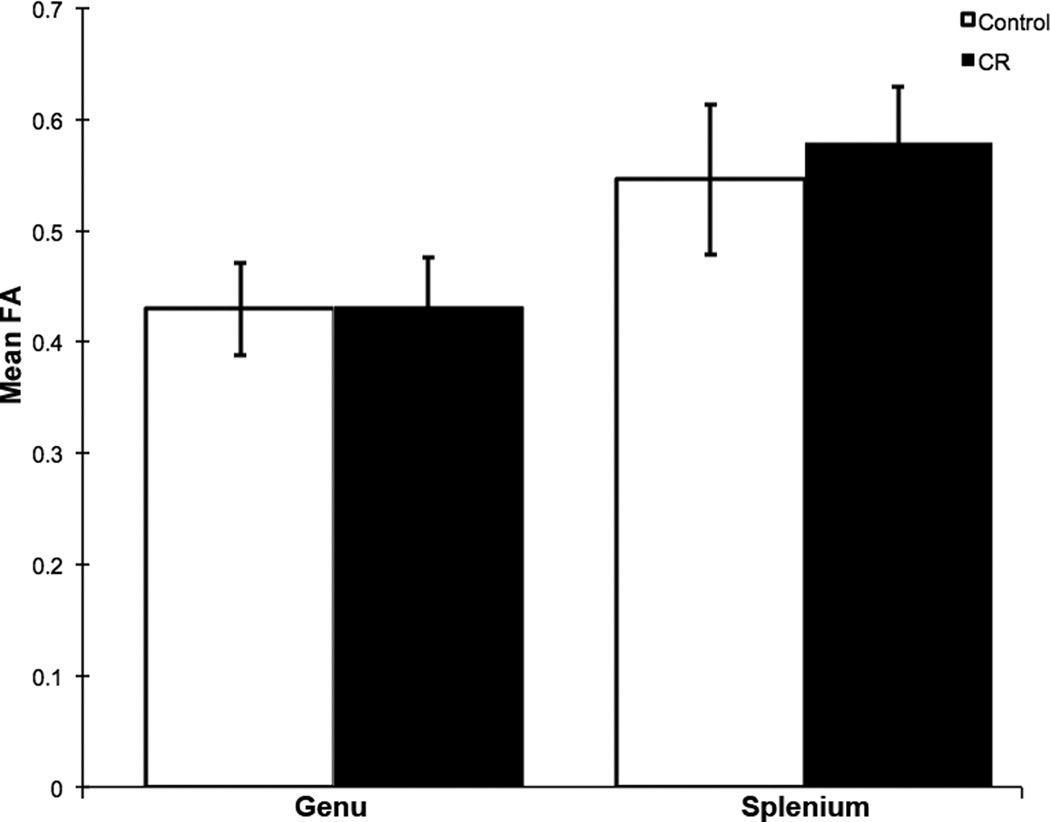
Figure 2. Mean FA of genu and splenium fibers of corpus callosum in rhesus monkeys.
Mean FA within posterior corpus callosum (splenium) fiber tracks was significantly greater than that of anterior corpus callosum (genu) fiber tracks in a combined analysis of control and calorie-restricted animals (t = −15.4, p < 0.001). Error bars represent standard deviation.

