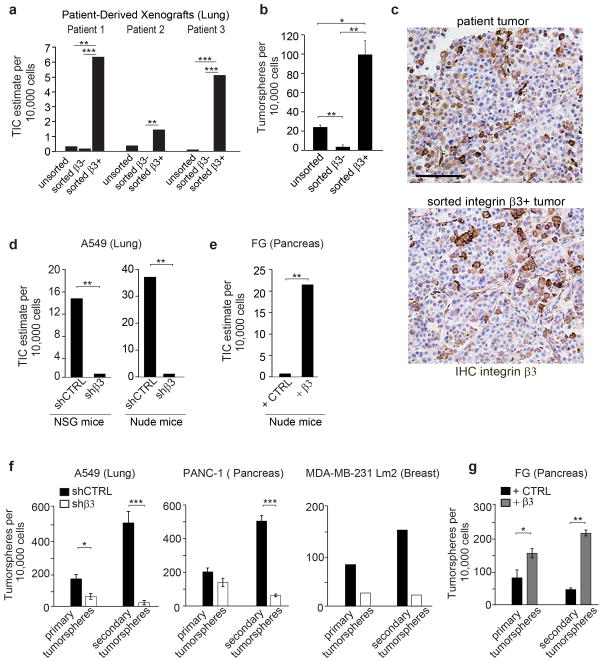
Figure 1. Integrin β3 expression drives a tumor-initiating cell phenotype.
(a) Frequency of tumor-initiating cells (TIC) in unsorted, integrin β3− and integrin β3+ subpopulations of cells from 3 NSCLC patients-derived xenografts. Cells were tested for tumor initiation in NOD/SCID Il2rγ−/− (NSG) mice. The n number of injection per condition for each patient are shown in Supplementary Figure 1a. The frequency of tumor-initiating cells per 10,000 cells was calculated using the ELDA extreme limiting dilution software. (b) Quantification of tumorspheres formed by the unsorted, the β3− and the β3+ populations from 3 NSCLC patients. n=3 independent experiments (3 technical replicates per experiment); mean ± SD.(c) Histological analysis of patient primary and β3+ subpopulation tumors. Tumors were stained for Integrin β3. Scale bar, 100 μm.(d)Frequency of tumor-initiating cells for A549 cells expressing shCTRL or shβ3 in NSG and nude mice. The n number of injection per condition for A549 shCTRL and A549 shβ3 are shown in Supplementary Figure 1d.(e)Frequency of tumor-initiating cells for FG cells expressing control vector or integrin β3 (FGβ3) in nude mice. The n number of injection per condition for FG and FGβ3 are shown in Supplementary Figure 1e.(f) Self-renewal capacity of A549, PANC-1 and MDA-MB-231 Lm2 cells expressing shCTRL or shβ3 measured by quantifying the number of primary and secondary tumorspheres. n= 3 independent experiments for PANC-1 and A549 (3 technical replicates per experiment). For MDA-MB-231 Lm2, n= 3 technical replicates of a representative experiment. mean ± SD. (g)Self-renewal capacity of FG expressing control vector (+ CTRL) or integrin β3 (+β3), measured by quantifying the number of primary and secondary tumorspheres. n= 3 independent experiments (3 technical replicates per experiment); mean ± SD. P value was estimated by Student’s t-test in b,f,g; χ2 test in a,d,e.*P< 0.05, **P< 0.01, ***P< 0.001. Original data for b,f,g are provided in the Statistical Source data (Supplementary Table 3).

