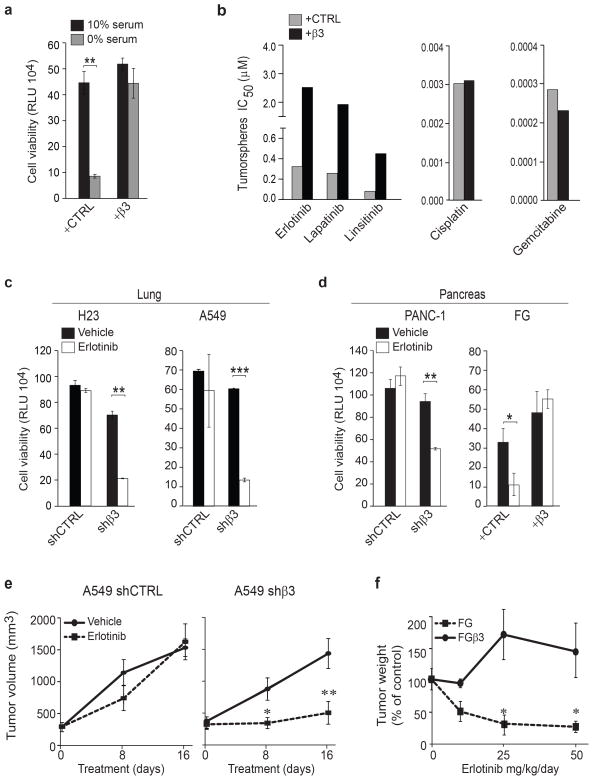
Figure 2. Integrin β3 drives RTK inhibitor resistance.
(a)Effect of serum deprivation on FG and FGβ3 cells measured by CellTiterGLO cell viability assay. Cells were grown in 3D in media with media containing 10% serum or 0% serum. Data are expressed in relative Luciferase Units (RLU). n= 3 independent experiments (2 technical replicates per experiment for CTRL and 3 technical replicates for +β3); mean ± SD.(b)Effect of integrin β3 expression (FG and FGβ3) on drug treatment response in pancreatic cancer cells. Cells in 3D culture were treated with a dose response of erlotinib, lapatinib, linsitinib, gemcitabine and cisplatin. IC50 are calculated using Graph Pad prism software. Data are representative of 2 independent experiments.(c–d) Effect of erlotinib treatment on lung (c) and pancreatic (d) cells expressing or lacking integrin β3 measured by CellTiterGLO cell viability assay. Cells were grown in 3D in media with 1μM of erlotinib. Data are expressed in relative Luciferase Units (RLU). n= 3 independent experiments (3 technical replicates per experiment); mean ± SD. (e)Effect of integrin β3 knockdown on erlotinib resistance in vivo, A549 shCTRL and A549 shβ3 (n= 8 mice per treatment group) were treated with erlotinib (25 mg/kg/day) or vehicle during 16 days. Tumor volumes are expressed as mean ± SEM. (f) Orthotopic FG and FGβ3 tumors (>1000 mm3; n= 7 mice for FG and n= 8 mice FGβ3 vehicle and n= 5 mice for each treatment group) were treated for 30 days with vehicle or erlotinib. Results are expressed as % tumor weight compared to vehicle control. mean ± SEM. P value was estimated by Student’s t-test in a,c,d,e,f.*P< 0.05, **P< 0.01, ***P< 0.001. Original data for a,b,c,d are provided in the Statistical Source data (Supplementary Table 3).

