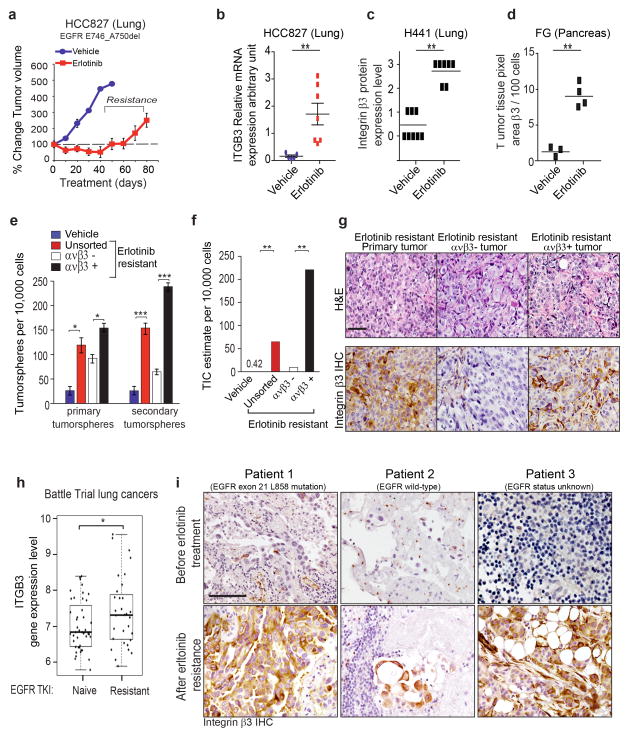
Figure 3. Acquired resistance to EGFR inhibition selects for a β3+ cell population with tumor-initiating cell properties.
(a) Effect of erlotinib treatment on HCC827 xenograft tumors. HCC827 cells were treated with vehicle control or erlotinib (25 mg/kg/day) until acquired resistance. Tumor dimensions are reported as the fold change relative to size of the same tumor on Day 1. n= 8 mice per group. Data are mean ± SEM. (b) Relative mRNA expression of integrin β3 (ITGβ3) in HCC827 vehicle-treated tumors (n= 5 tumors) or erlotinib-treated tumors (n= 7 tumors) from (a). Data are mean ± SEM.(c) Quantification of Immunohistochemistry staining of integrin β3 in mouse orthotopic lung H441 tumors treated with vehicle (n= 8 tumors) or erlotinib (n= 7 tumors) was scored (scale 0 to 3).(d) Quantification of integrin αvβ3 expression in pancreatic human FG xenografts treated 4 weeks with vehicle (n=3 tumors) or erlotinib (n=4 tumors). Integrin αvβ3 expression was quantified as ratio of integrin αvβ3 pixel area over nuclei pixel area using Metamorph software. Data are mean. (e) Self-renewal capacity of HCC827 vehicle-treated (vehicle) and erlotinib-treated tumors (erlotinib resistant unsorted) from (a). The HCC827 erlotinib-treated tumors have been sorted in two groups: the integrin β3− and the integrin β3+ population. n= 3 independent experiments (3 technical replicates per experiment); mean ± SD. (f) Frequency of tumor-initiating cells for HCC827 vehicle-treated (vehicle), erlotinib-treated (erlotinib resistant unsorted), erlotinib-treated β3− population and erlotinib-treated β3+ population. The n number of injection per condition for FG and FGβ3 are shown in Supplementary Figure 3e (g) Histological analysis of primary HCC827 erlotinib resistant xenografts and Integrin β3+ and Integrin β3− subpopulations. Tumors were stained for H&E and Integrin β3. Scale bar, 50 μm. (h) Box plot comparing integrin β3 (ITGβ3) gene expression in human lung cancer biopsies from patients from the BATTLE Study24 who were previously treated with an EGFR TKI and progressed (n=31 patients), versus patients who were EGFR TKI naïve (n=43 patients). The box shows the median and the interquartile range. The wiskers show the minimum and maximum. (i) Immunohistochemical analysis of integrin β3 expression in paired human primary lung cancer biopsies obtained before and after erlotinib resistance. Scale bar, 100 μm. P value was estimated by Student’s t-test in b,c,d,e,h; χ2 test in f.*P< 0.05, **P< 0.01. ***P< 0.001. Original data for d,e are provided in the Statistical Source data (Supplementary Table 3).

