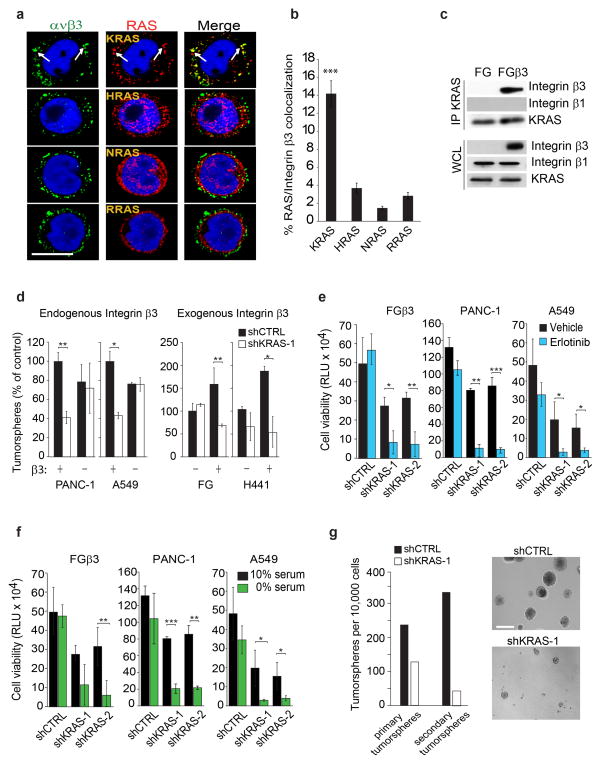
Figure 4. Integrin β3/KRAS complex is critical for integrin β3-mediated tumor-initiating phenotype and EGFR inhibitor resistance.
(a) Confocal microscopy images of FGβ3 cells grown in 3D and stained for integrin αvβ3 (green) and RAS family members (red). Scale bar, 10 μm. Data are representative of three independent experiments. (b)Quantified percentage of cells with colocalization of Integrin β3 and RAS in (a). Data shown represent mean ± SEM. n= 11 fields for KRAS and RRAS and 10 fields for HRAS and NRAS.(c) Immunoblot analysis of KRAS immunoprecipitates from FG and FGβ3 cells. Data are representative of three independent experiments. (d) Effect of KRAS knockdown on tumorspheres formation in lung and pancreatic cancer cells expressing or lacking integrin β3. n= 3 independent experiments (3 technical replicates per experiment); mean ± SD.(e) Effect of KRAS knockdown on β3-mediated erlotinib resistance measured by CellTiterGLO cell viability assay for FGβ3, PANC-1 and A549. Cells were grown in 3D in media and treated with 1μM of erlotinib. Data are expressed in relative Luciferase Units (RLU). n= 3 independent experiments (2 technical replicates per experiment); mean ± SD. (f) Effect of KRAS knockdown on β3-mediated survival under serum deprivation measured by CellTiterGLO cell viability assay for FGβ3, PANC-1 and A549. Cells were grown in 3D in media containing 10% or 0% serum. Data are expressed in relative Luciferase Units (RLU). n= 3 independent experiments (2 technical replicates per experiment); mean ± SD. (g) Self-renewal capacity of FGβ3 cells expressing non-target shRNA control (shCTRL) or KRAS-specific shRNA (shKRAS) measured by quantifying the number of primary and secondary tumorspheres. n= 3 wells per group. mean ± SD. Data are representative of 2 independent experiments. Phase contrast images of self-renewal tumorspheres of FGβ3 cells expressing non-silencing shRNA CTRL or specific KRAS shRNA. Scale bar, 100 μm. P value was estimated by Student’s t-test in b,d,e,f,g.*P< 0.05, **P< 0.01, ***P< 0.001. Uncropped western-blots are provided in Supplementary Figure 7 and original data for b,d,e,f,g are provided in the Statistical Source data (Supplementary Table 3).

