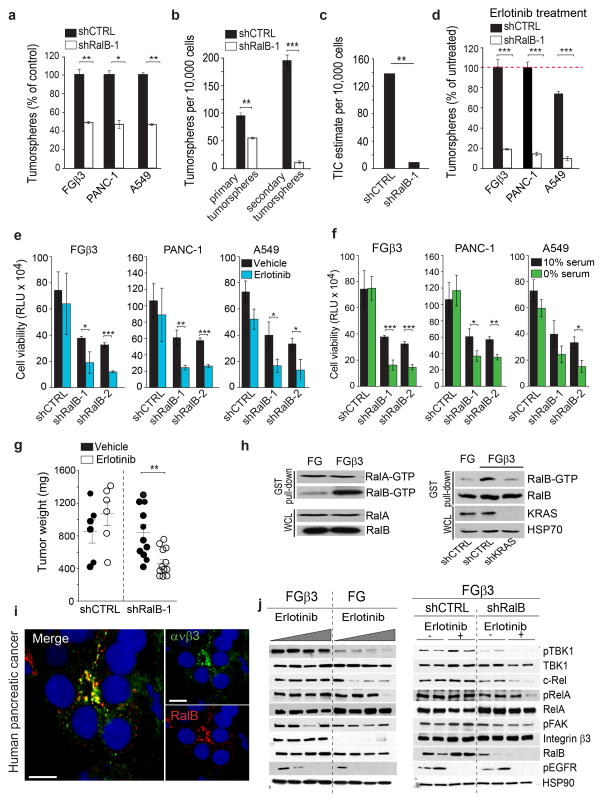
Figure 6. RalB is a key modulator of integrin β3-mediated tumor-initiating phenotype and EGFR inhibitor resistance.
(a) Effect of RalB knockdown on β3-mediated anchorage independence. n= 3 independent experiments (3 technical replicates per experiment); mean ± SD. (b) Self-renewal capacity of FGβ3 expressing shCTRL or shRalB measured by quantifying the number of primary and secondary tumorspheres. n= 3 independent experiments (3 technical replicates per experiment); mean ± SD. (c) Limiting dilution in vivo determining the frequency of tumor-initiating cells for FGβ3shCTRL and FGβ3 shRalB. The n number of injection per condition for FG and FGβ3 are shown in Supplementary Figure 5c.(d)Effect of RalB knockdown on β3-mediated erlotinib resistance measured by tumorspheres formation. n= 3 independent experiments (3 technical replicates/experiment); mean ± SD.(e–f)Effect of RalB knockdown on β3-mediated erlotinib (e) and nutrient deprivation (f) resistance measured by CellTiterGLO cell viability assay. n= 3 independent experiments (2 technical replicates per experiment); mean ± SD. (g) Effect of RalB knockdown on β3-mediated erlotinib resistance of human pancreatic (FGβ3) orthotopic tumor xenografts. Established tumors expressing shCTRL or shRalB (>1000 mm3) were randomized and treated for 10 days with vehicle or erlotinib (50 mg/kg/day). Results are expressed as tumor weight± SEM. n=6 mice for FGβ3 shCTRL vehicle and erlotinib treated groups and n=11 mice for FGβ3 shRalB vehicle treated, and n=13 mice for FGβ3 shRalB erlotinib treated groups. (h)Left, RalA and RalB activities were determined in cells grown in suspension using a GST-RalBP1-RBD immunoprecipitation assay. Data are representative of three independent experiments. Right, Effect of KRAS knockdown on RalB activity. Data are representative of three independent experiments.(i) Confocal microscopy images of integrin αvβ3 (green), RalB (red) and DNA (TOPRO-3, blue) in tumor biopsies from pancreatic cancer patients. Scale bar, 10 μm.(j) Left, Immunoblots showing expression of indicated proteins in representative FG and FGβ3 tumor xenografts from Figure 2f analyzed at treatment day 30. Right, Immunoblots showing expression of indicated proteins in representative FGβ3 shCTRL and FGβ3 shRalB tumor xenografts from (i) analyzed at treatment day 10. P value was estimated by Student’s t-test in a,b,d,e,f,g; χ2 test in c.*P< 0.05, **P< 0.01, ***P< 0.001. Uncropped western-blots are provided in Supplementary Figure 7 and original data for a,b,d,e,f, are provided in the Statistical Source data (Supplementary Table 3).

