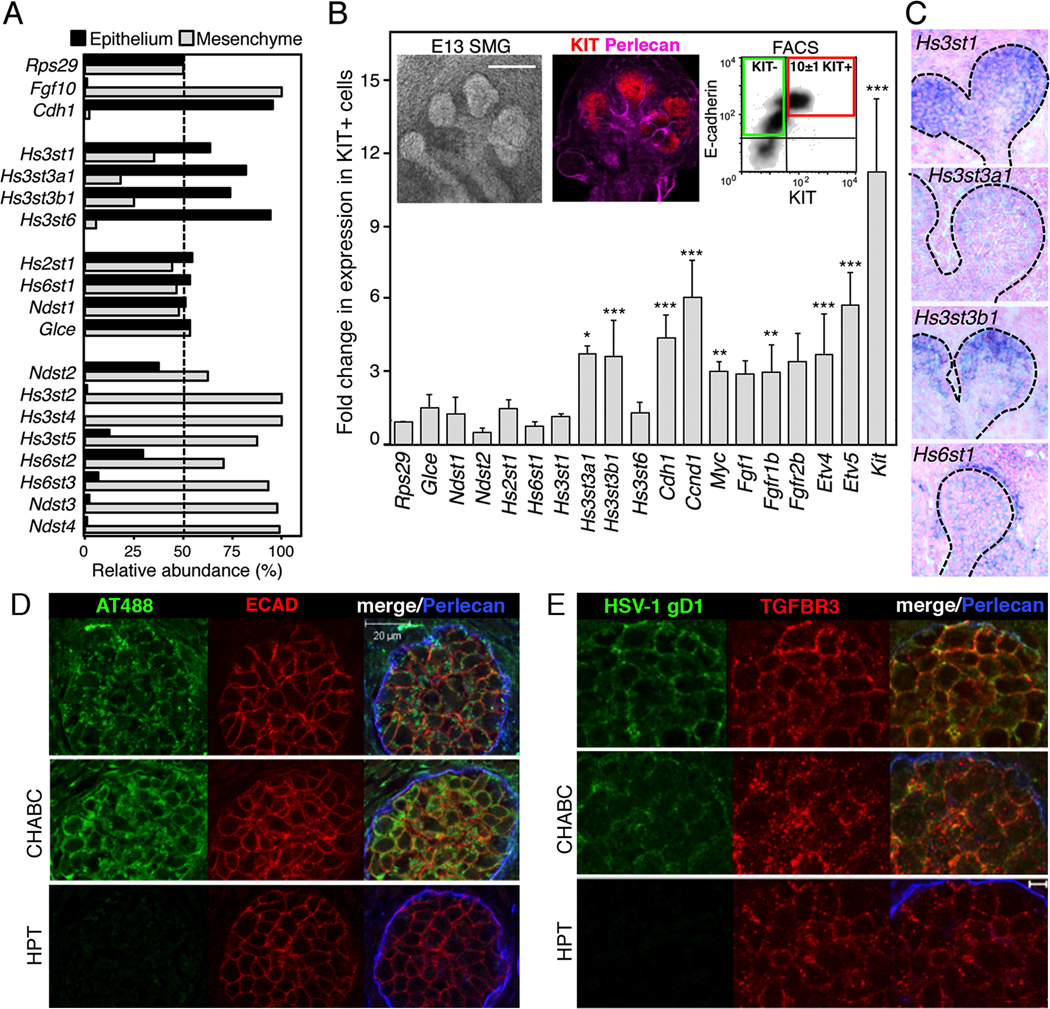
Figure 1. KIT+ epithelial endbud progenitors are enriched for HS 3-O-sulfotransferase expression and 3-O-HS is localized in the epithelial endbuds.
(A) qPCR analysis of isolated E13 SMG epithelia and mesenchyme. Gene expression was normalized to Rps29.
(B) The expression levels of HS biosynthetic enzymes were compared by qPCR in cDNA from the KIT+ versus KIT− ECAD+ FACS sorted cells. Gene expression was normalized to expression in the KIT− cells and Rps29. A false discovery rate (Q) for multiple unpaired t-tests was set to 5%. *p ≤ 0.05 **p ≤ 0.01 and ***p ≤ 0.001. Error bars: SEM. Images are single confocal projection with KIT (red) and Perlecan (pink) labeling in an E13 SMG. Scale bar; 200 µm. FACS plot shows KIT+ ECAD+ cells (red box) and KIT− ECAD+ cells (green box) sorted from E13 SMGs.
(C) Sections of whole-mount in situ analysis of E13 SMG confirm the localization of Hs3st isoforms in the endbud (dotted line); counterstained with nuclear fast red.
(D) Staining of E13 SMGs with labeled antithrombin (AT488, green). Heparitinase (HPT) but not chondroitinase (CHABC) treatment for 2 hr abolished AT488 labeling. Perlecan (blue) localized in the basement membrane and ECAD (red) labeled the epithelium. Images are single confocal sections, scale bar: 20 µm.
(E) Staining with HSV-1 gD285 protein localized Hs3st3-type 3-O-HS at the epithelial cell surface. Heparitinase treatment also decreased binding of HSV-1 gD (green). Perlecan (blue) and TGFBR3 (red), which stains the epithelium, are shown. Images are single confocal sections, scale bar: 5 µm.
See also Figure S1.

