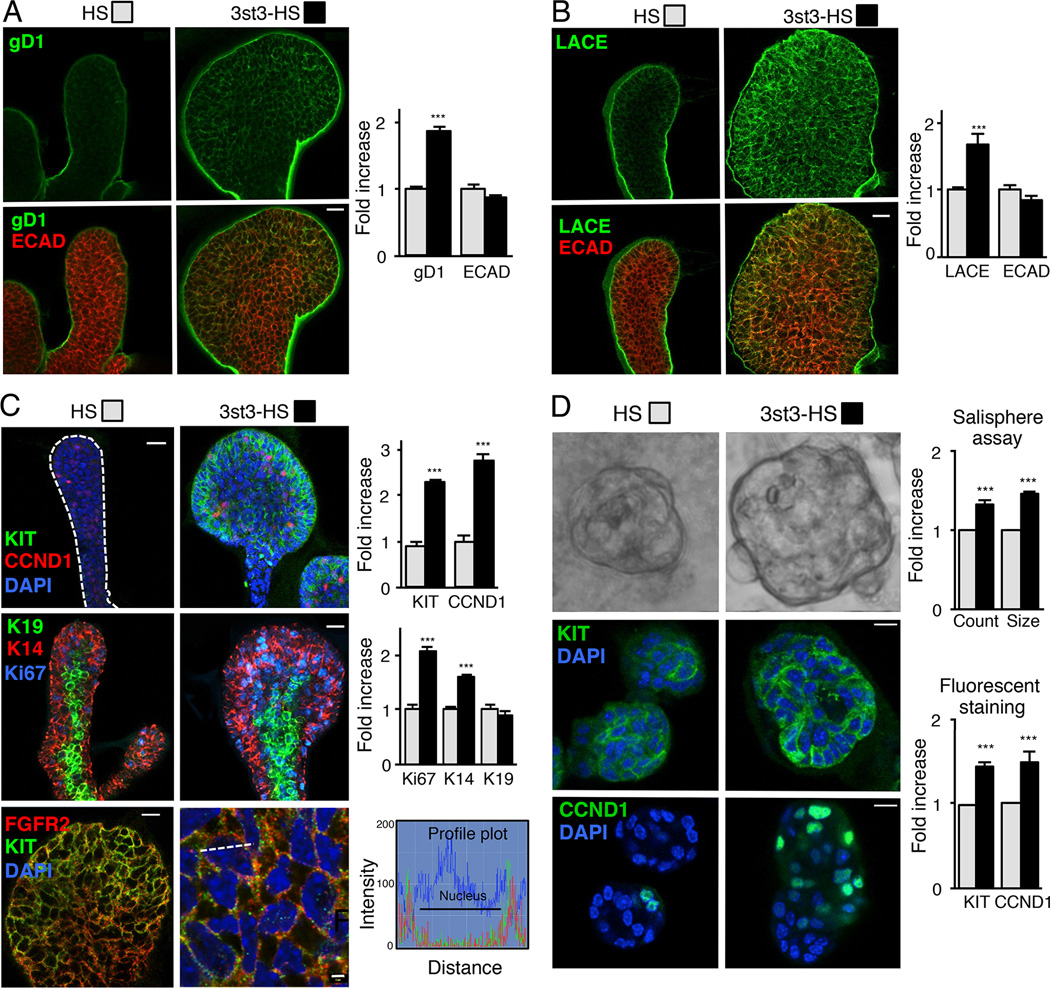
Figure 6. 3-O-sulfated-HS increases endogenous 3-O-HS, FGF10/FGFR2b-Fc binding, proliferation and KIT expression.
(A–C) FGF10 cultured E13 SMG epithelia treated with HS or 3st3-HS for 28 hr were stained. (A) gD1 staining (green) or (B) with FGF10/FGFR2b-Fc (LACE assay, green) and ECAD (red). (C) CCND1, KIT (green) and DAPI (blue) top panels, K14 (red), K19 (green), Ki67 (blue) middle panels, and FGFR2 (red), KIT (green) and DAPI (blue) lower panels. The profile plots (lower right) quantify the relative intensity of the KIT and FGFR2 protein distribution at the position along the white dotted line in the overlay image. The fluorescence signal from anti-KIT-Cy2 colocalized with anti-FGFR2-Cy3 immunofluorescence signal with an overlap coefficient of r=0.54 ± 0.015. Images are 2 µm confocal sections. Scale bars: 10 µm and 2 µm in lower right panel. Quantification of fluorescence intensity normalized to total nuclei staining and expressed fold increase compared to HS treated epithelia. At least five epithelia from three independent experiments were used for quantification.
(D) 3-O-HS treatment increases salisphere size (upper panel). Quantification of the number and diameter of salispheres formed after 3 days. 3-O-HS increases both the count and size of salispheres compared to HS. Confocal sections of salispheres cultured for 6 days with HS or 3st3-HS stained with KIT (green, middle panel) and CCND1 (green, lower panel). Quantification of KIT and CCND1 fluorescence intensity normalized to total nuclei staining and expressed as a fold increase compared to HS treated salispheres. At least five salispheres from each of three independent experiments were used for quantification. Scale bar; 10 µm.
Error bars: SEM. Student’s t-test; *p < 0.05, **p < 0.01, and ***p < 0.001.

