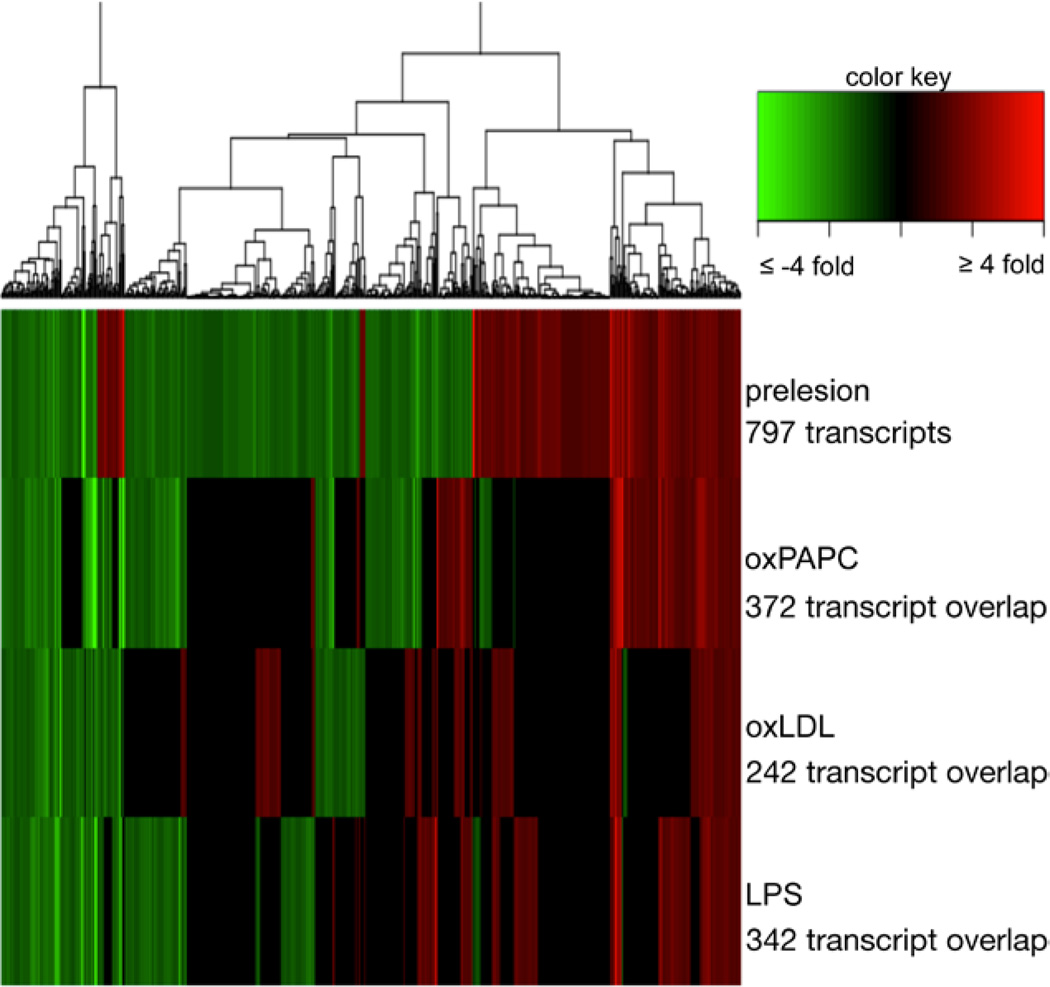
Figure 3.
Differential gene expression of mouse aortic endothelial cells (MAECs) isolated from prelesion compared with healthy aortas and the overlap with treated MAECs. Heatmap displaying differential expression of gene expression transcripts in MAECs. The top bar displays differential expression of MAECs isolated from healthy to prelesion aortas with 10% false-discovery rate. The red bars indicate upregulation of expression from healthy to prediseased, whereas green bars indicate downregulation. The next 3 rows show differential expression data of the same 797 differentially expressed prelesion transcripts in MAECs treated with 1-palmitoyl-2-arachidonoyl-sn-glycero-3-phosphocholine (oxPAPC), oxidized low-density lipoprotein (oxLDL), or lipopolysaccharide (LPS), respectively. Gene expression cut-off for treatment is 1.2-fold and is maximized at an absolute value of 4 for purposes of graph visualization. Numbers below treatments indicate the number of transcripts that are regulated in the same direction as prelesion samples.

