
Figure 4.
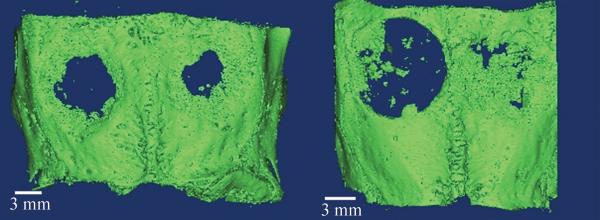
Representative three-dimensional reconstructions of microCT data thresholded for bone. Each sample has two defects (L,R). Groups A, B (top left), Groups B, D (bottom left)
Official websites use .gov
A
.gov website belongs to an official
government organization in the United States.
Secure .gov websites use HTTPS
A lock (
) or https:// means you've safely
connected to the .gov website. Share sensitive
information only on official, secure websites.
Representative three-dimensional reconstructions of microCT data thresholded for bone. Each sample has two defects (L,R). Groups A, B (top left), Groups B, D (bottom left)