FIGURE 5.
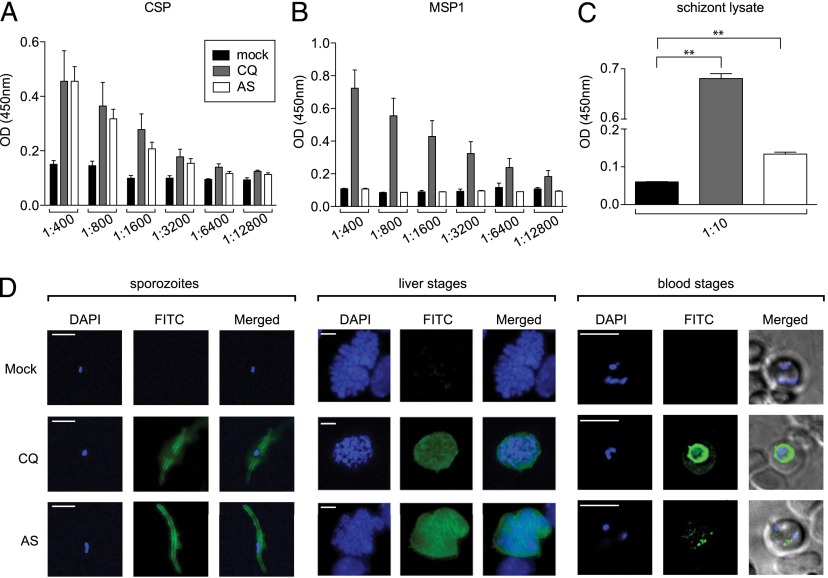
Sera from mice treated with CQ- or AS-ITV recognize pre-erythrocytic and erythrocytic Ags and parasites to different degrees. (A–C) Reactivity of serum collected from mock-immunized, untreated mice (mock, black bars), CQ-ITV–treated (CQ, gray bars), or AS-ITV–treated (AS, white bars) mice 9 d after the third immunization against pre-erythrocytic protein CSP B cell epitope QGPGAP (A), erythrocytic MSP 1 protein (B), or schizont lysate (C) by ELISA. The y-axis shows OD at 450 nm. The x-axis indicates the dilution factor of the sera used for CSP (A) and MSP1 (B); a 1:10 dilution of sera was used for the schizont lysate (C). Significance was analyzed using two-tailed Mann–Whitney tests. Error bars represent SEM. **p < 0.01. (D) Immunofluorescence assays with serum collected from mock-immunized, untreated mice (top panel), CQ-ITV–treated mice (middle panel), or AS-ITV–treated mice (bottom panel), on P. yoelii spz (left panel); LSs (middle panel); or BSs (right panel). Serum reactivity is shown in green (FITC), and DNA staining is shown in blue (DAPI). Merge images show a merge of the green and blue channels. Scale bar, 10 μm.

