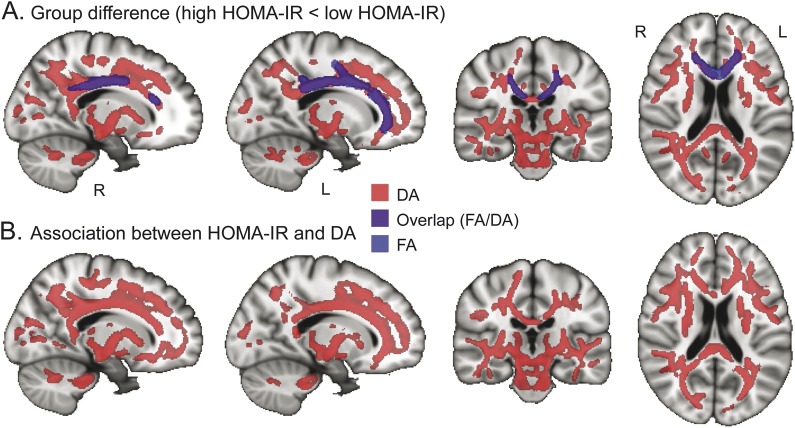
Figure 1. TBSS maps of the effect of HOMA-IR on DTI parameters in middle-aged and older adults.
(A) Reduced DA (light red) and FA (light blue) in the high HOMA-IR group (n = 27) compared with the low HOMA-IR group (n = 100). Purple indicates overlapping of DA and FA reduction. (B) Association between DA and HOMA-IR in all participants. Light red indicates the regions where higher HOMA-IR is associated with lower DA. The statistical maps (p < 0.05, corrected for multiple comparisons, controlling for age, white matter signal abnormality volume, and antihypertensive medication status) are thickened to aid visualization and superimposed on the Montreal Neurological Institute template image. DA = axial diffusivity; DTI = diffusion tensor imaging; FA = fractional anisotropy; HOMA-IR = homeostasis model assessment of insulin resistance; TBSS = Tract-Based Spatial Statistics.

