
Figure 1. Correlation between PGRN levels in plasma and CSF.
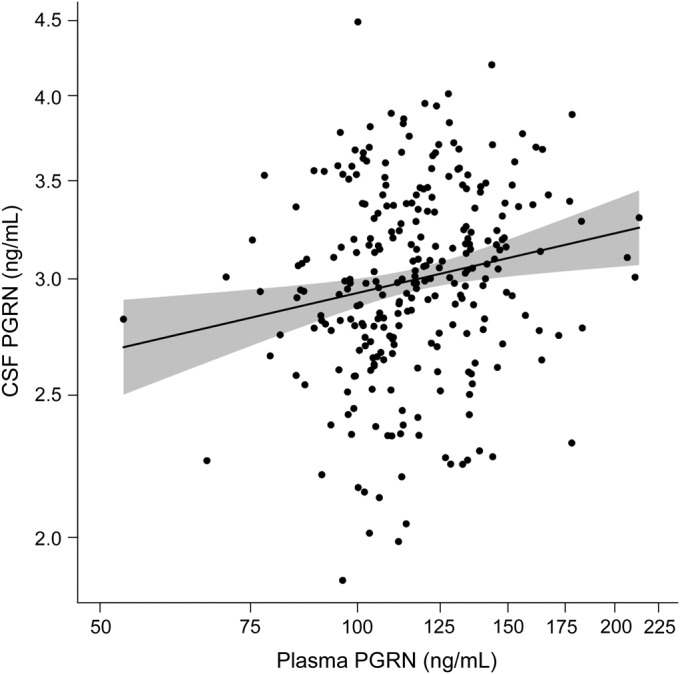
Scatter plot depicting the correlation between plasma and CSF protein levels in 273 individuals. The trend line indicates the estimated mean log-transformed CSF progranulin (PGRN) levels as a function of log-transformed plasma PGRN levels while controlling for sex and age at CSF collection. The shaded region represents the 95% confidence interval. Values on the axes are back-transformed to represent PGRN values as their original units.