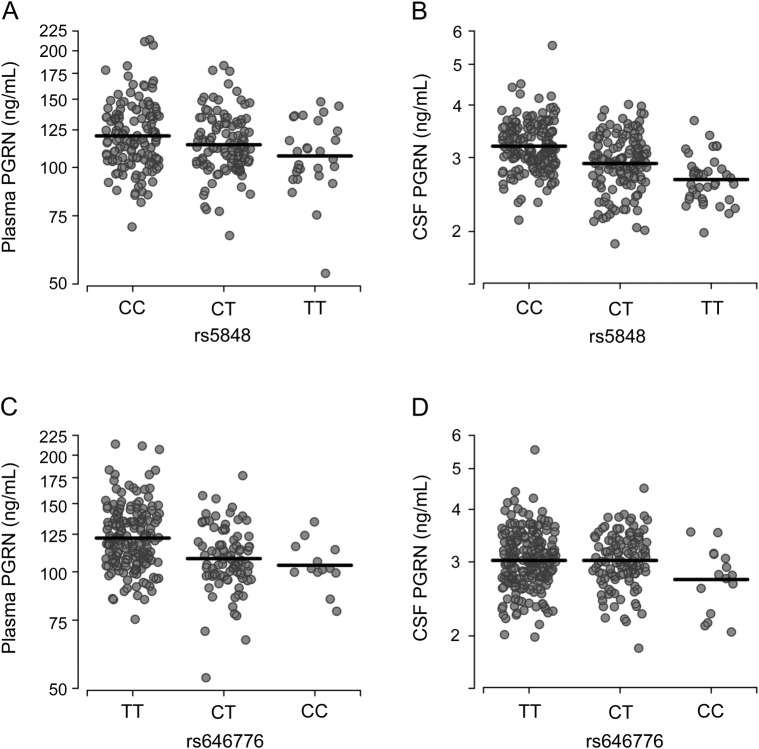
Figure 2. PGRN levels in plasma and CSF by rs5848 or rs646776 genotype.
(A, B) Scatter plots representing the log-transformed plasma (A) and CSF (B) progranulin (PGRN) levels in individuals expressing the different rs5848 genotypes. (C, D) Scatter plots representing log-transformed plasma (C) and CSF (D) PGRN levels in individuals expressing the different rs646776 genotypes. Values on the axes are back-transformed to represent PGRN values as their original units.

