
Figure 1. Percentage of subjects by number of infarcts in subjects with and without microinfarcts.
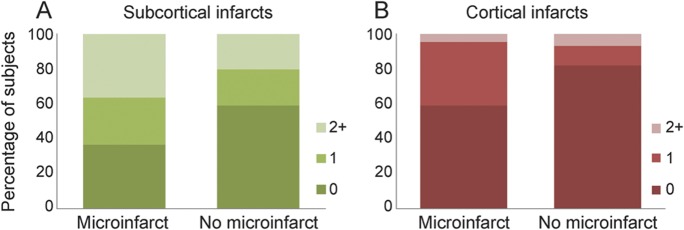
Plots show percentage of subjects by number of infarcts within each patient group. Colors represent numbers of subcortical and cortical infarcts (see legends). Presence and number of subcortical infarcts were associated with presence of microinfarcts (A). Presence and number of cortical infarcts were associated with presence of microinfarcts (B).