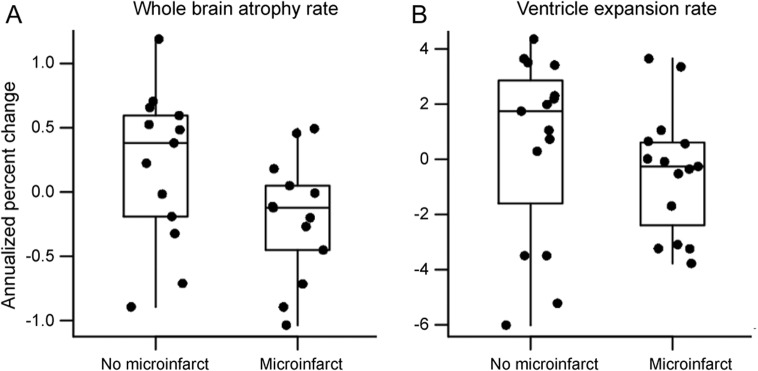
Figure 2. Group differences in whole-brain atrophy.

(A) Rate of whole-brain atrophy measured using boundary shift integral was higher (p = 0.05) in subjects with microinfarcts. (B) Rate of ventricular volume increase was not different between the 2 groups (p = 0.37).
