
Figure 4. Theoretical relationship of brain amyloid load and hypometabolism in AD.
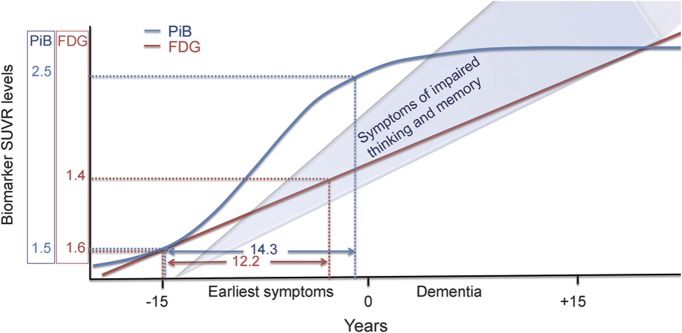
Theoretical dose relationship of brain amyloid load (blue SUVR) and hypometabolism (red SUVR) predicted in normal subjects from these data. The biomarker relationships are estimated for relative to future disease status categorizations as “early symptoms” and “dementia” on the x-axis timeline. The SUVR projections are based on the initial SUVR relationships starting at a PiB SUVR of 1.5 and thereafter projected based on previously determined yearly change rates for PiB and FDG SUVR values in this population. AD = Alzheimer disease; FDG = [18F]-fluorodeoxyglucose; PiB = Pittsburgh compound B; SUVR = standardized uptake value ratio.