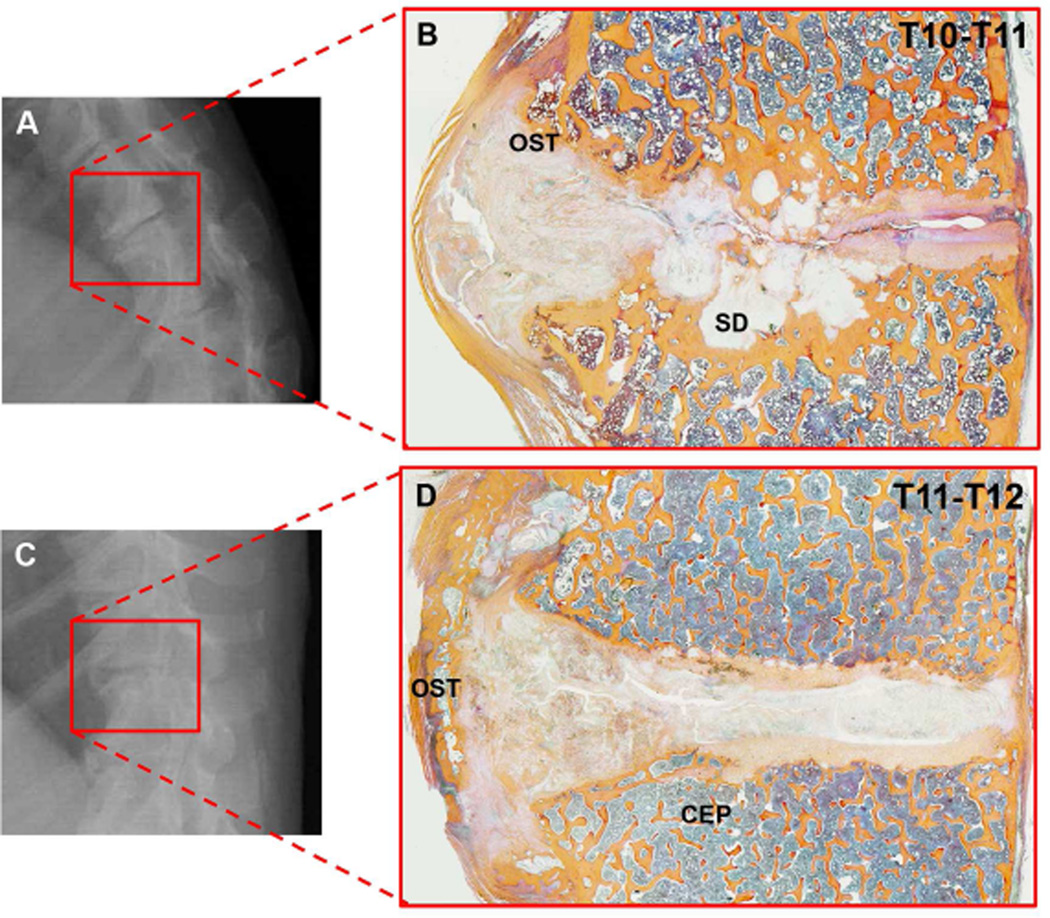
Figure 4.
A & C are examples of disc spaces on radiographs of separate rhesus monkeys and B & D show the same disc spaces via histology. B shows a cluster of sclerotic depressions (SD) at the center of the endplate. D on the other hand, shows a bridged osteophyte (OST) that is visible via radiograph, but could promote a “healthier” radiographic assessment of disc space narrowing because it holds the disc space apart – while via histology we see that the disc is degenerated. Histology sections in figure are stained with Mallory-Heidenhain.

