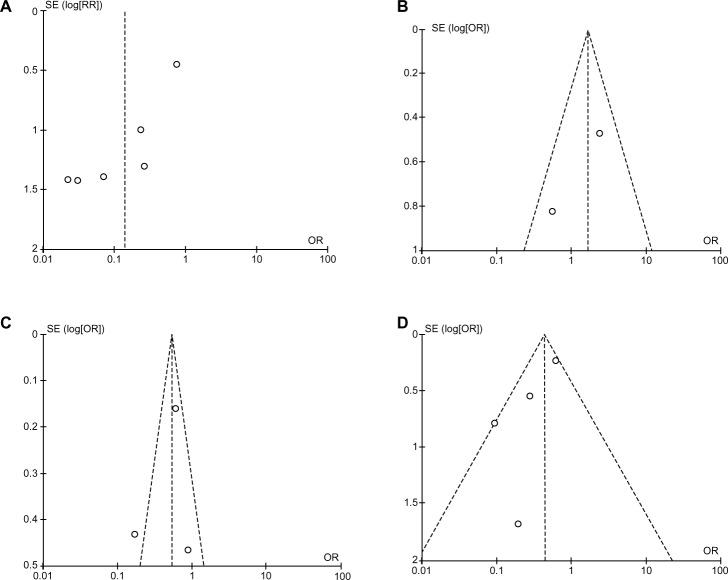
Figure 6.
Funnel plots, which are largely symmetrical, suggesting there were no publication biases in the meta-analysis of RUNX3 hypermethylation/expression and clinicopathological features. (A) Funnel plot from six studies comparing colorectal cancer (CRC) with normal colorectal mucosa. (B) Funnel plot from two studies comparing CRC and colorectal adenoma. (C) Funnel plot from three studies comparing different stages of CRC. (D) Funnel plot from four studies comparing microsatellite instability (MSI)-positive and MSI-negative CRC.
Notes: X axis, value of OR; Y axis, SEs multiplied by log scale of OR.
Abbreviations: OR, odds ratio; SE, standard error.

