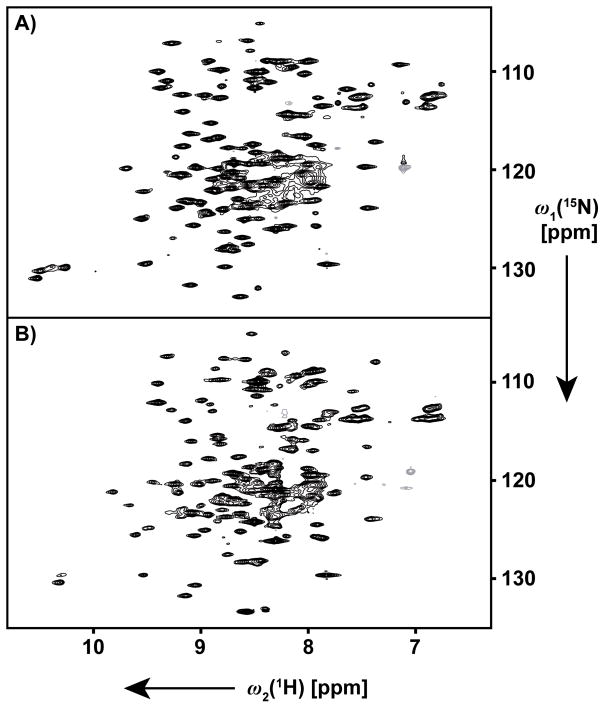
Figure 2.
2D [15N,1H]-TROSY correlation NMR spectra of [80%-2H,u-13C,u-15N]-OmpA at T = 313 K recorded in standard 5 mm sample tubes at 800 MHz. A) 1.0 mM OmpA in Fos-10 micelles. B) 0.7 mM OmpA in DMPC nanodiscs. Acquisition and processing parameters: data size 256 (t1) × 2,048 (t2) complex points; t1max = 45.1 ms; t2max = 71.0 ms; 16 (A) and 64 (B) scans per t1-increment; overall measurement times 1 h (A) and 5 h (B). Identical data handling as in Figure 1. Apparent differences, specifically for the Trp indole resonances at 1H chemical shifts between 10 and 11 ppm, are due to a combination of two factors. Firstly, the signal intensities in panel B are lower than the corresponding lines in panel A. Secondly, differences are to be attributed to the different environments of OmpA in the Fos-10 micelles and the DMPC nanodiscs

