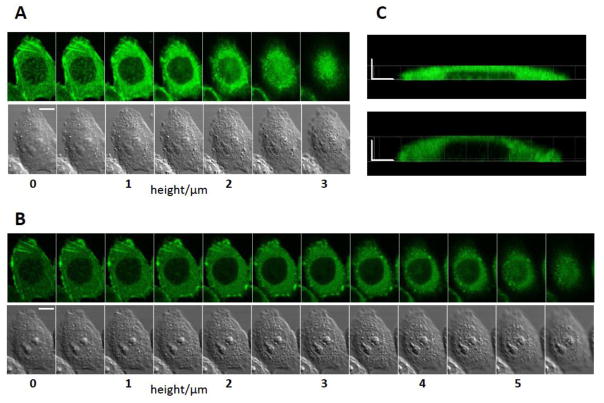
Fig. 2.
Cell swelling and reorganization of actin following nsPEF exposure (1 pulse at 20 kV/cm, 600 ns). A and B: Z-stacks of fluorescence and DIC images of the same cell taken immediately prior to nsPEF (A) and 20 min after it (B). The leftmost images are at the level of the coverslip surface (the bottom of the cell), and the height is increased in 0.5 μm steps. C: side views of the cell actin reconstructed from Z-stacks in A (top, before exposure) and B (bottom, 20 min post nsPEF). The scale bars are 10 μm (A and B) and 5 μm (C). Note cell swelling, partial disassembly of actin features, and overall reduction of fluorescence after nsPEF.

